Why 60% of US & EU Manufacturers Are Quietly Beating Offshore Costs with AI-Driven, Hyper-Automated Micro-Factories
2026-09-04 15:00:00
#CEO#Chief Supply Chain Officer (CSCO)#CFO#VP of Manufacturing#Chief Architect
EXECUTIVE SUMMARY
Two reshoring stories are running in parallel in 2026, and most boardrooms are listening to the wrong one.
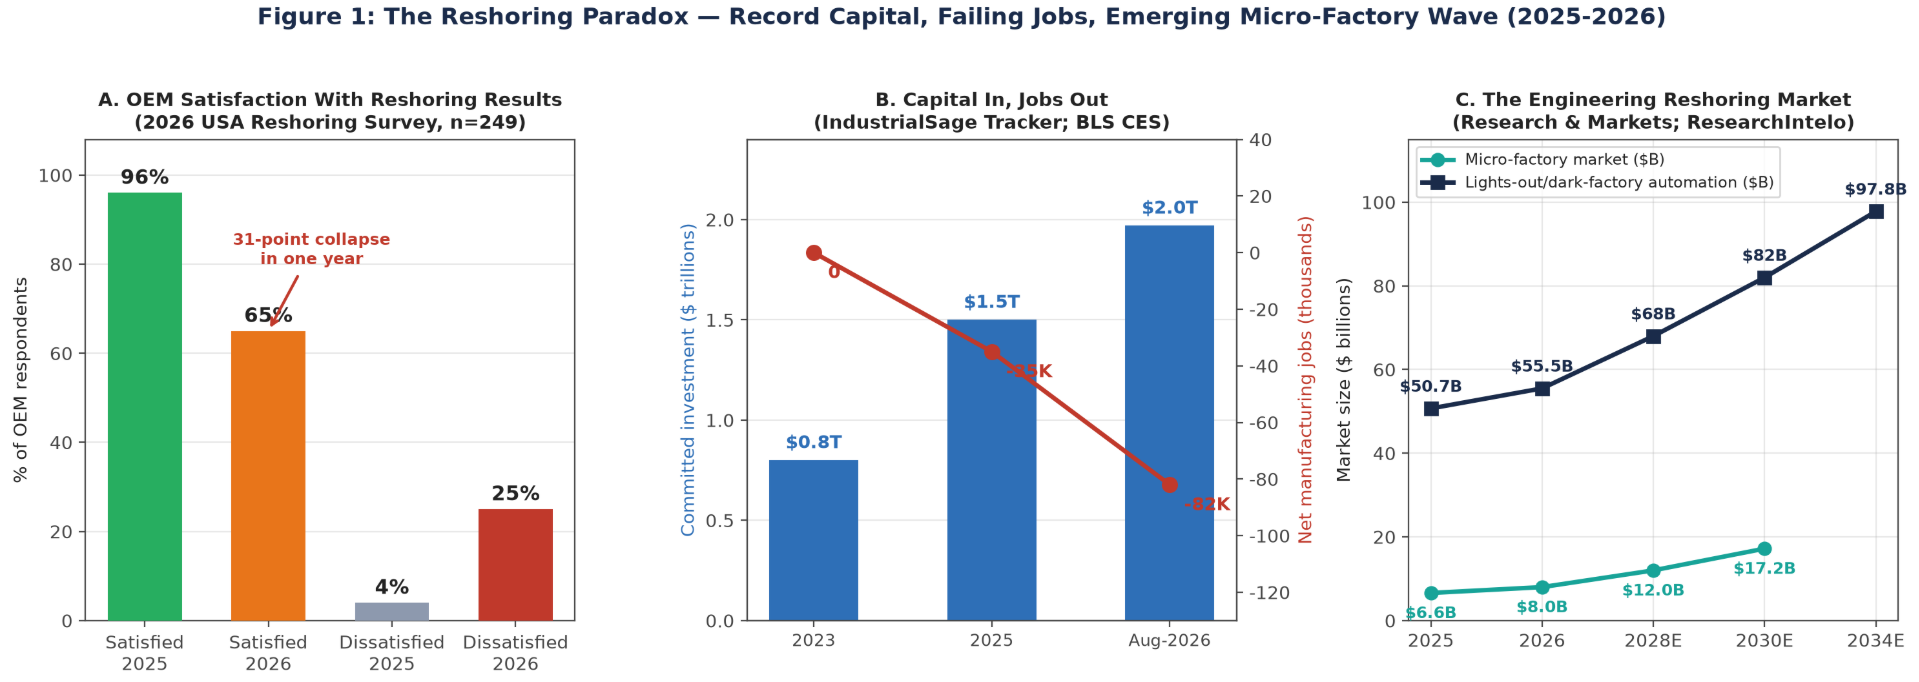
The political story is failing. The 2026 USA Reshoring Survey of 249 OEMs and contract manufacturers — the definitive industry dataset run by the Reshoring Initiative — records that OEM satisfaction with reshoring results collapsed from 96% in 2025 to 65% in 2026, with dissatisfaction jumping from 4% to 25%. The Institute for Supply Management reports that 64% of manufacturers have no intention of reshoreing to escape tariffs. Whirlpool cut 341 workers at its Amana, Iowa plant in March 2026 while breaking ground on a $160 million complex in Mexico; Stanley Black & Decker absorbed roughly $800 million in annualized tariff costs and moved production from China to Mexico — not to the United States. Meanwhile, Bureau of Labor Statistics data shows U.S. manufacturing employment is down 82,000 net since January 2025, even as announced manufacturing investment sits near $2 trillion. Tariffs, policy whiplash, and the fantasy that factories can be re-imported with a 1995 cost structure have produced a politically loud but operationally disappointing reshoring wave.
The engineering story is winning — quietly. In the same twelve months, a different migration took place on factory floors rather than in press releases. Companies stopped asking "how do we bring the jobs back?" and started asking "how do we bring the capacity back without the jobs?" The answer converged on a new industrial object: the hyper-automated micro-factory — a compact (500–50,000 sq ft), software-defined, near-lights-out production unit, staffed by 5–15 people instead of 50–500, deployable in 4–9 months for $0.2–5 million instead of 3–7 years and $50–500 million, and capable of batch-of-one economics that were unthinkable five years ago.
The economics behind it are now decisive:
This whitepaper is written for the executives who have to place the bets: the CEO deciding whether the next decade of supply-chain strategy is built around cheap labor or cheap intelligence; the CSCO redesigning a network that was optimized for the 2005–2018 world; the CFO who has been presented with reshoring business cases that don't survive contact with the skilled-labor market; the VP of Manufacturing who knows automation is coming but needs a deployment sequence that doesn't shut the line; and the Chief Architect who must turn "micro-factory" from a slide into an engineered, governed, and maintainable system.
What follows is deliberately zero-BS. We will show you why the first reshoring wave disappointed, why the micro-factory wave is structurally different, what the honest TCO math looks like, which industries should reshore now versus hybridize versus wait, how the six-layer reference architecture actually fits together, and what a 90-day first move looks like. We end with the Yunzhibian SKU catalog that delivers each of these layers as a scoped, priced, deployable unit — because strategy without a bill of materials is a sermon.
The headline claim in one sentence: cheap labor was never the durable source of offshore advantage — scale was, and scale has been software-eaten; the manufacturers who rebuild around hyper-automated, demand-proximate micro-factory networks will, within five years, hold both lower TCO and shorter lead times than the offshore mega-plants they replace.
PART I — THE PARADOX: TWO RESHORINGS, ONE WINNING
Chapter 1 — The $2 Trillion Headline and the 82,000 Missing Workers
Start with the two numbers that ought to be impossible to say in the same breath.
Number one: since the beginning of 2025, **roughly $1.97 trillion in U.S. manufacturing investment** has been announced across 234 companies and 42 states, tracked weekly by IndustrialSage against SEC filings, press releases, and government announcements. Apple has committed $600 billion. TSMC's Arizona build-out is $265 billion across ten fabs. Micron is at $260 billion across Idaho, Virginia, and New York. Factory construction spending hit $235.6 billion in 2024 — nearly triple the $81.9 billion of 2021. Foreign direct investment into U.S. manufacturing totals $2.42 trillion, 42% of all inbound FDI. U.S. manufacturing value-added hit an all-time record of $2.91 trillion in 2024 — as a standalone economy, the sector would rank eighth in the world. The ISM Manufacturing PMI hit 54 in May 2026, its strongest reading in four years.
Number two: in early 2026, U.S. manufacturing employment stood at approximately 12.69 million — about 82,000 fewer than in January 2025. Net jobs are going down while announced investment goes up at a pace not seen since the Second World War.
Pundits resolve the contradiction by picking a side. The boosters say the jobs will arrive when the fabs finish. The skeptics say the announcements are press releases. Both are wrong, and both miss the actual story — which is that the factories being built in this cycle were never designed to need the jobs.
The TSMC Arizona campus is the clearest example. It is a fab built around extreme automation: material handling, process control, metrology, and logistics are robotic by default; the 12,000 direct jobs at full build-out support a facility whose output per worker is an order of magnitude above the semiconductor plants of the 1990s. Micron's New York complex, Tesla's lines, the Hyundai Metaplant in Georgia — the $1.39 trillion of semiconductor and advanced-technology commitments on the tracker are automation-first constructions. Eighty-eight percent of the jobs announced in 2024 were in high or medium-high technology sectors. This is not your grandfather's factory building boom, where a new plant meant 5,000 assemblers with wrenches. It is a capacity boom designed to run on engineers, robots, and software.
The employment data isn't a lagging indicator waiting to catch up. It is an early indicator of what the new capacity actually is.
Chapter 2 — The Satisfaction Collapse
If the capital story is bullish, the human story — as told by the people who actually ran reshoring projects — is considerably more sober.
The 2026 USA Reshoring Survey, conducted by the Reshoring Initiative in collaboration with Regions Recruiting, sampled 249 companies: 118 OEMs and 131 contract manufacturers, split across C-suite and operational leadership and across company sizes. It is the only survey that separates OEMs (who move production) from CMs (who receive it), and it is the dataset executives in this industry trust. Its findings this year are a cold shower:
Read that last point carefully, because it is the hinge of this entire whitepaper. The labor market is not failing to supply workers. It is failing to supply robot-ready technicians — the exact people an automated factory needs. The economy has millions of people who can staff a 1980s assembly line and a desperate shortage of people who can keep a 2026 robotic cell calibrated. Manufacturers are trying to reshore 2026 technology into a 1995 labor model, and the result is predictable: projects overrun, headcounts go unfilled, unit costs come in above the offshore quote, and satisfaction collapses.
The survey's one genuinely encouraging structural finding: there was a ten-point swing in a single year away from incomplete costing methods and toward total-cost-of-ownership analysis, and positives from reshoring (speed to market, on-time delivery) still averaged twice the negatives. The companies that are succeeding are the ones making decisions on full TCO rather than piece-price — and the ones designing around the skilled-labor constraint rather than wishing it away.
Chapter 3 — The Tariff Reflex: Why Whirlpool Went to Mexico
The political theory of reshoring was simple: raise the cost of importing enough, and production comes home. The 2025–2026 policy experiment tested this theory at scale. The results are in, and they are not kind to the theory.
When Whirlpool announced the second round of layoffs at its Amana, Iowa plant in March 2026 — 341 workers — it simultaneously expanded a new $160 million manufacturing complex in Mexico. Stanley Black & Decker, facing an estimated $800 million annualized tariff cost impact in 2025, responded precisely as the tariff designers hoped it wouldn't: it moved production out of China — into Mexico and other lower-tariff countries, not into Connecticut. The ISM's own analyst noted dryly that 64% of manufacturers reported no intention of reshoring production to avoid tariff costs, with a significant portion actively seeking partners in lower-tariff-exposure countries across Asia, Latin America, and Eastern Europe.
Why did the tariff reflex fail? Three reasons, all mechanical rather than ideological:
The policy environment isn't irrelevant — Section 232 steel and aluminum tariffs, the CHIPS and Science Act, defense onshoring mandates, and the manufacturing provisions of the 2025 budget legislation all shape the map — but policy is weather, not a business model. The companies winning this cycle are building on something tariffs can't give and can't take away: a production cost structure that beats offshore on the numbers, duty-free.
Chapter 4 — The Other Reshoring
Walk a different set of floors in 2026 and you hear no complaints about the reshoring climate — because nobody in these facilities is waiting on policy.
You'll find a sheet-metal operation in Chatsworth, California where two workers bolt together a brand-new robotic factory while an identical cell seven feet away forms drone skins with no dies, no molds, and no tooling lead time — Machina Labs, which raised a $124 million Series C in February 2026 with Lockheed Martin Ventures and Toyota's Woven Capital participating, and whose deployable system fits into two ISO shipping containers and becomes operational hours after arrival (the U.S. Air Force already uses it to sustain aircraft whose original suppliers and parts no longer exist).
You'll find welding cells across the Midwest where arc-on time — the share of time the arc is actually depositing metal — runs 70–85% against 25% for a human welder, defect rates sit below 1% against a 5–8% manual baseline, and a fully integrated cell pays back in 8–14 months on two shifts, in a labor market where the American Welding Society projects a shortage of 330,000 qualified welders by 2028.
You'll find a consumer-goods plant where 50 autonomous mobile robots replaced 36 forklift operators across three shifts, pushing throughput up 37% (185 to 253 pallets per shift), delivery accuracy from 97.6% to 99.8%, and safety near-misses from six per month to zero — $4.8 million in annual savings against a $5.6 million deployment, 14-month payback, with 32 of the 36 operators redeployed to higher-paid roles.
You'll find electronics assembly cells where defects fell from 1,200 parts per million to 18, changeover from 45 minutes to 7, and unit labor cost from $38 to $21.
You'll find these facilities in industrial parks outside Columbus, Monterrey, Querétaro, Stuttgart, Guadalajara, Phoenix, and rural Ohio. They are small. They are quiet — many run dark on the night shift. They are staffed by handfuls of technicians instead of shifts of hundreds. They are near the customers they serve. And they are, line by line, beating the offshore quote on fully costed economics — not because of tariffs, not because of patriotism, but because the underlying cost stack changed.
This is the reshoring that the satisfaction survey doesn't capture well, because its unit of analysis is a company moving a product line, while the real unit of value creation is a cell or a micro-plant coming online. It is also the reshoring that doesn't announce itself in press releases — because once your lead time drops from 90 days to 9 and your unit TCO drops 30%, that's a competitive advantage you don't shout about.
Chapter 5 — Defining the Hyper-Automated Micro-Factory
Let's be precise about the object at the center of this whitepaper, because "micro-factory" is a term at risk of becoming marketing mush.
A hyper-automated micro-factory, as defined by Yunzhibian's architectural practice, is a production unit with all of the following characteristics:
This is not a machine shop with a robot. It is a fundamentally different economic object: a factory whose minimum efficient scale is measured in thousands of units rather than millions, whose location decision follows demand density rather than wage gradients, and whose capacity expands by adding modular cells rather than constructing buildings.
The market has noticed. Research and Markets sizes the global micro-factory market at $6.61 billion in 2025, growing 21.2% to $8.01 billion in 2026 and $17.18 billion by 2030. Parallel estimates from Stratistics MRC place the related micro-factory ecosystems market at $3.2 billion (2026) → $6.8 billion (2034) and decentralized micro-manufacturing at $6.3 billion (2026) → $20.0 billion (2034, 15.4% CAGR). These facilities sit inside and drive the broader lights-out/dark-factory automation market: $50.73 billion in 2025, projected at $97.8 billion by 2034 (ResearchIntelo), where lights-out plants report OEE above 91% against 74% for conventional facilities and labor-cost reductions of 40–70%.
Chapter 6 — The Core Paradox
Everything in this whitepaper resolves a single paradox, stated as plainly as we can:
Three reversals destroyed the old model, and each gets its own section of this whitepaper:
Unlock the Remaining 88% of Evaluations & the Decision Engine
The second half includes: a core solution cross-comparison matrix, a key parameter selection checklist, an implementation pitfalls guide, and a TCO & ROI calculator for mainstream approaches.
Get Your Custom Solution (View in Dashboard)