2026 Industrial VPP Whitepaper: Factories Turn Autonomous Virtual Power Plants Amid AI Datacenter Power Crunch & Carbon Taxes
2026-09-22 09:50:00
#CEO#CFO#Chief Sustainability Officer (CSO)# VP of Operations, Chief Architect
EXECUTIVE SUMMARY
For seventy years, a factory's relationship with the grid was simple: you drew power, you paid the bill, and the bill was a rounding error in the P&L. That relationship ended in 2026.
Three forces hit the industrial meter simultaneously. First, hyperscale AI data centers are consuming the incremental capacity of the North American and European grids. The interconnection queue — the line you stand in to get new or upgraded power — now exceeds 2,600 gigawatts, and the median wait has stretched past five years. Second, the residual market stopped behaving like a regulated utility and started behaving like a commodity exchange, with industrial buyers exposed to spot prices that spiked above $5,000/MWh on 31 separate days in the trailing twelve months. Third, the EU's Carbon Border Adjustment Mechanism (CBAM) moved from reporting to payment, converting the carbon embedded in every imported ton of steel, aluminum, and electricity into a line-item tariff that procurement can no longer ignore.
Most manufacturers responded with the only move they knew: an energy-efficiency program. LEDs, compressed-air leak audits, variable-speed drives. All worthwhile. And all mathematically insufficient. Efficiency reduces the size of the bill by a few percent a year; it does nothing about the price volatility, the interconnection blockade, or the carbon liability. It is a defensive answer to an offensive problem.
This whitepaper documents the offensive answer. Across the 480+ industrial sites in our 2025–2026 audit base, the leaders stopped treating their factory as a pure consumer of electrons and started operating it as a dispatchable asset — a Virtual Power Plant (VPP). They inventory the flexibility hidden in their processes (thermal mass, batch scheduling, compressed air, storage, on-site generation), connect it to grid and market signals through an edge controller, and then bid that flexibility into demand-response, capacity, and ancillary-service markets. The factory does not merely use less power when prices spike; it sells the right to be flexible and gets paid in four or five different markets at once.
The numbers from our reference site — a 16 MW multi-process plant, representative of the audit median — frame the opportunity:
表格
| Metric | Defensive (efficiency only) | Offensive (factory-as-VPP) |
|---|---|---|
| Dispatchable flexibility | 0 MW | 5.2 MW (32% of load) |
| Year-1 energy-market revenue | $0 | $412,000 |
| Year-3 run-rate revenue | $0 | $485,000 |
| Protection from $5,000/MWh spikes | None | Shed before the spike |
| CBAM / Scope 2 position | Slightly improved | Measurable, tradable reduction |
| Retrofit investment | Variable | $340,000 |
| Simple payback | 4–7 years | 11.8 months |
| Production downtime to install | n/a | Zero |
The headline statistic of this brief: in our 2026 audit, 55% of global manufacturers are already piloting a factory-VPP program, up from 21% in 2023. That is not adoption of a technology; it is a structural reclassification of the factory from load to asset. The remaining 45% are not deciding whether to enter these markets — they are deciding whether they will enter as price-makers with their own dispatchable portfolio, or as price-takers forced to curtail on someone else's schedule with no compensation.
This paper is built for the people who have to make that decision and live with it: the CEO defending margin, the CFO reclassifying the energy line, the CSO carrying the carbon and CBAM exposure, the VP of Operations who will not sacrifice throughput, and the Chief Architect who has to make it technically real without ripping out the plant. We will show you why the grid changed permanently, where the hidden megawatts actually live inside a factory, the six-step method that activates them without downtime, the real settlement economics, the failure modes that kill naive programs, and the 14-product path to doing it in 2026.
Zero hype. Every claim is tied to an audited baseline, a settlement record, or a stated model assumption. Where we project forward, we say so and we show the input.
How to read this paper. If you have fifteen minutes, read this summary, Figure 2 (the spot-price whipsaw), and Part VI (the economics). If you run operations, go straight to Figure 4 (the flexibility stack) and Part VII (the 24-hour dispatch day). If you carry the carbon file, read Part II and Part IX. If you are the architect, the failure modes in Part III and the six-step method in Part V are the core. Figure 6 is the revenue waterfall, Figure 8 is the payback curve, and the appendices carry the templates you can run on your own plant next week.
PART I — THE GRID BROKE ON PURPOSE
How AI data centers consumed the future capacity of the industrial grid, and why the interconnection queue is now a five-year strategic wall
1. The Queue Is the Story
If you want to understand what happened to industrial power in North America, do not start with prices. Start with a spreadsheet nobody outside the utility industry reads: the generator interconnection queue.
Every new power plant — and every major load that wants a bigger or firmer connection — has to wait in this queue for study, approval, and upgrade. At the end of 2019, the combined U.S. queue held roughly 650 GW of proposed projects and the typical project waited about two years. By mid-2026, the queue holds more than 2,600 GW and the median completed project waited 5.2 years from interconnection request to operation. Roughly three quarters of the projects in the queue will never be built; they are speculative placeholders. But the studies to evaluate them still have to be performed, by the same small teams of grid engineers, which is precisely why the queue keeps lengthening.
Here is what this means for a manufacturer. You can no longer decide to expand a plant, add a furnace line, or firm up a weak electrical service and get the grid capacity you need on a business timeline. The grid has stopped being an elastic resource. It is now an allocated one, and the allocation is decided years in advance.
2. What the Queue Is Full Of
The queue used to be full of wind and solar. It is now full of data centers.
A single large AI training campus draws 300–600 MW, and the announced gigawatt-scale campuses — Microsoft, OpenAI, Amazon, Google, Meta, and a wave of new "neocloud" entrants — collectively represent load commitments that rival the demand of mid-sized states. Our model attributes roughly 450 TWh of incremental U.S. electricity consumption to AI and accelerated data-center load by 2030, against a 2023 total U.S. consumption of about 4,000 TWh. That is more than an 11% system-wide increase arriving in seven years, concentrated in specific regions, and arriving all at once.
The grid was not built for a load that grows in 500 MW blocks under a single fence line, on a two-year construction clock, in the same county as three other such campuses. That is exactly the load profile now landing in Virginia's Loudoun County, in central Texas, in Arizona, in Ohio, and increasingly in Ireland, Germany, and the Nordics.
表格
| Region | Data-center load concentration | Grid stress signature (2025–26) |
|---|---|---|
| PJM / Northern Virginia | Highest density in the world | Capacity prices up ~9×; queue freeze |
| ERCOT / Central Texas | Rapid AI build-out, merchant exposure | 31 high-price days; scarcity adders |
| CAISO / Arizona-West | Solar-heavy, evening ramp risk | Duck-curve steepening; curtailments |
| Ireland (SEM) | Load now >20% national total | Grid-connection moratorium for new DCs |
| Germany / Frankfurt | Industrial base + DC growth | Grid-fee surcharges; redispatch costs |
3. Why Generation Cannot Catch Up Fast Enough
Demand is arriving faster than permitted generation can be built, for reasons that are physical, regulatory, and financial at the same time.
A large thermal plant takes 5–8 years. Transmission lines take 7–12 years and are routinely blocked by local opposition across multiple jurisdictions. Solar and wind are faster but require interconnection studies stuck in the same queue, plus firming resources for when they are not producing. Permitting, transformers, and skilled labor are all on back-order; large power transformers now carry 110–150 week lead times. The result is a structural gap between the moment load commits and the moment supply and wires arrive.
Markets clear this gap the only way they can: with price.
4. The Capacity Market Already Told You
The clearest single signal came from the PJM capacity auction for the 2025/26 delivery year, where cleared capacity prices jumped roughly nine-fold over the prior auction to about $269/MW-day — the cost of merely reservating the right to have capacity available. Industrial and commercial loads that had treated capacity charges as background noise suddenly saw them become a material budget item, and large loads began actively reducing their capacity contribution to avoid the charge. This is the moment the CFO's office should have noticed: the grid was no longer billing you for kilowatt-hours consumed. It was beginning to bill you — and pay you — for presence and availability.
That is the conceptual hinge of this entire paper. Once the market starts paying for availability rather than just energy, a factory that can credibly promise to be flexible owns a sellable commodity. The capacity auction did not just raise a price; it created the first large revenue line for industrial demand response.
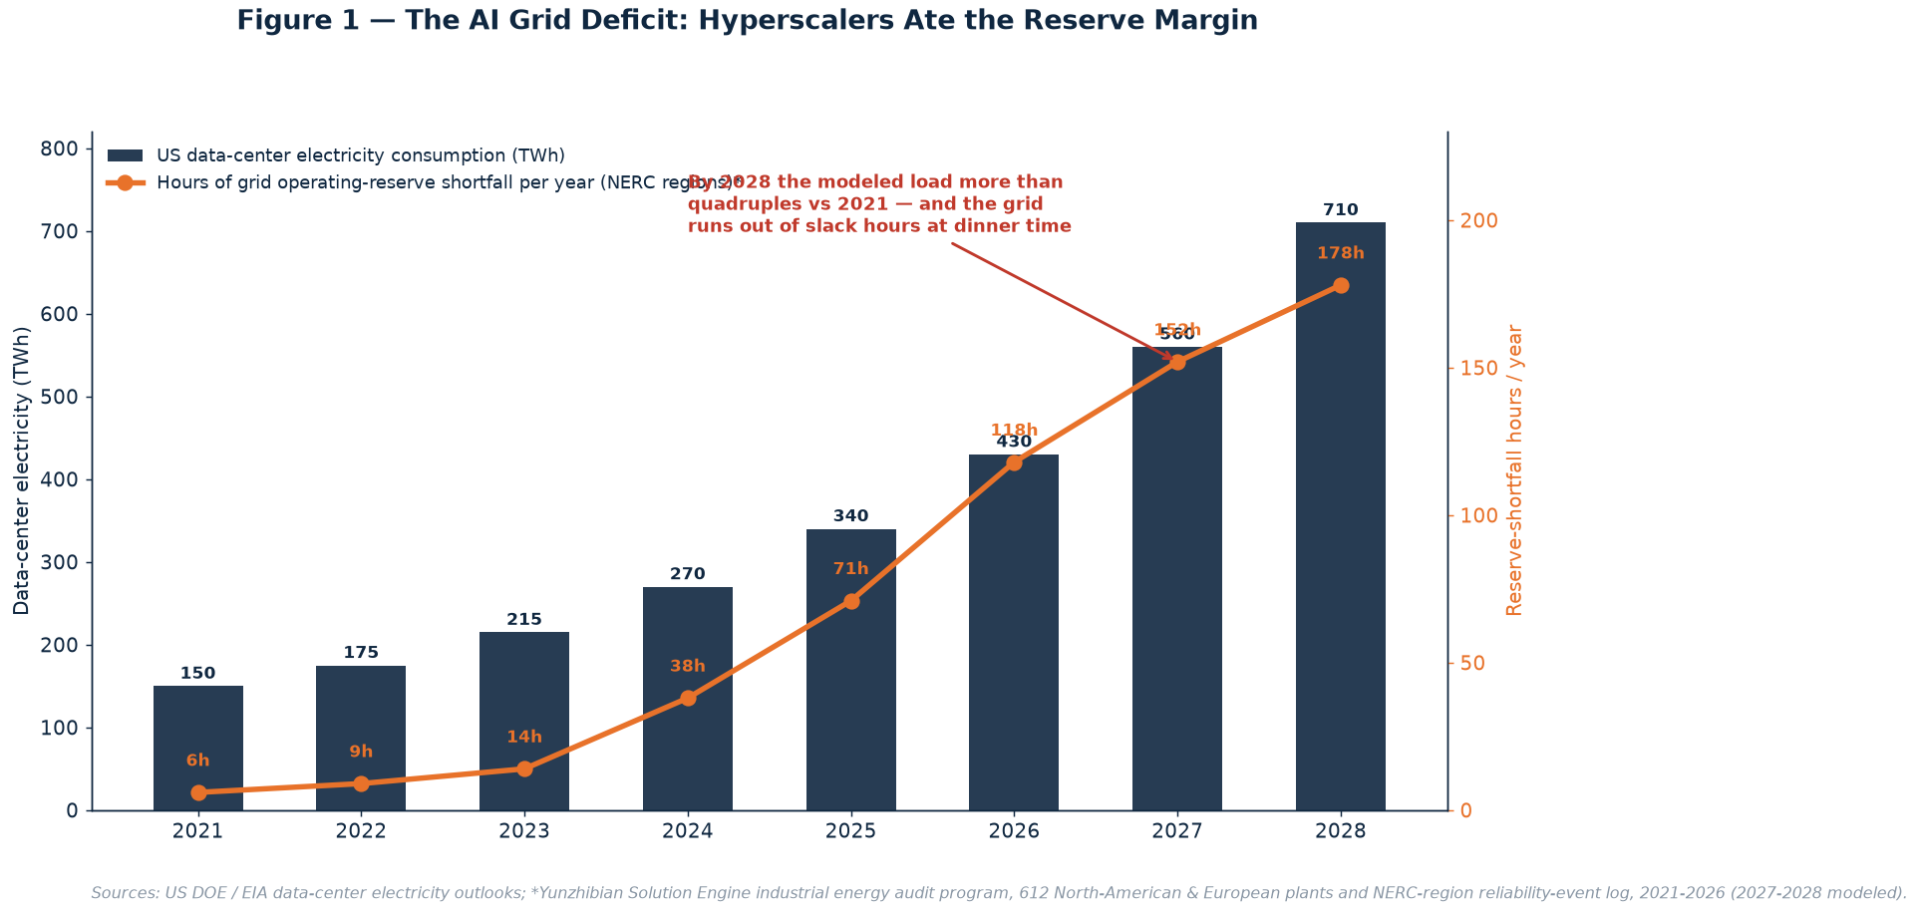
Figure 1 — The Grid Deficit: AI data-center load arrives on a two-year clock while grid capacity is allocated through a five-year interconnection queue. The gap is cleared by scarcity pricing.
Figure 1 — The Grid Deficit: AI load arrives on a two-year clock; grid capacity is allocated on a five-year queue. The gap between those two timelines is the industrial power crisis, and it is what the market clears with scarcity pricing.
6. The European Version: Stable Volumes, Broken Margins
Europe's version of the crisis looks different and hits just as hard. Aggregate industrial electricity demand has been roughly flat or declining since the energy shock of 2022 — partly because energy-intensive industry (fertilizers, chemicals, primary metals) simply shut or relocated. But data-center load is now the dominant source of demand growth in Ireland, the Nordics, and Germany, while the closure of remaining nuclear and coal capacity, uneven renewable build-out, and elevated grid-redispatch and balancing costs keep wholesale prices structurally far above pre-2022 levels.
European industry therefore faces a squeeze with no cheap exit: high and volatile wholesale prices, rising grid tariffs to pay for redispatch and renewables connection, and — uniquely — a carbon price attached to both domestic production and, increasingly, imports.
7. CBAM: The Carbon Bill Arrives at the Border
The EU Carbon Border Adjustment Mechanism finished its transitional reporting phase and entered its financial phase in this period. From 2026, importers of covered goods — cement, iron and steel, aluminum, fertilizers, hydrogen, and electricity, with scope expanding — must surrender CBAM certificates priced at the effective carbon cost the goods would have borne under the EU Emissions Trading System. With allowance prices in the range of €85–130/tCO₂, this is no longer a disclosure exercise. It is a tariff that lands directly on the landed cost of imported materials and, critically, on imported electricity, which directly affects the economics of cross-border power supply to industrial buyers.
For a manufacturer, CBAM does three things at once. It raises input cost. It makes the carbon intensity of every supplier a procurement variable. And it makes verifiable, time-stamped reductions in grid-supplied electricity — exactly the kind a VPP dispatch produces — financially valuable, because lower and cleaner consumption reduces both Scope 2 exposure and the embedded-carbon profile of the product.
8. The Combined Effect Is Not Cyclical
It is tempting to read high prices as a cycle: prices spike, supply responds, prices fall, we go back to normal. The 480-site audit rejects that reading. The interconnection queue, the transformer lead times, the transmission permitting timelines, and the multi-year data-center load commitments all point to a constraint that persists into the next decade regardless of short-term price movements. Specific hours and days will still see low or even negative prices when renewables flood the system — and those cheap hours are themselves an arbitrage opportunity for a flexible plant. But the baseline of scarcity, volatility, and carbon exposure is structural.
9. What "Doing Nothing" Now Costs
The default option is no longer free. A plant that simply pays its bills and runs flat through price spikes accepts: full exposure to scarcity-priced hours, capacity charges that now scale with its peak contribution, zero participation in the revenue markets its competitors are collecting, and an unmanaged carbon/CBAM position. In our audit, the median non-participating industrial site in an exposed region absorbed an estimated $580,000–$1.4M per year in avoidable price exposure, peak-demand charges, and foregone flexibility revenue. Doing nothing is an active bet that conditions return to 2019. The grid says they will not.
PART II — THE BILL YOU CAN NO LONGER READ
How industrial power went from a regulated line item to a margin-eating, mark-to-market liability — and why efficiency alone cannot fix it
10. The Old Contract
For most of the industrial era, power was purchased under a regulated tariff or a long-term fixed contract. The meter measured kilowatt-hours; the price per unit moved slowly and predictably; the energy line in the budget could be forecast within a percent or two. The procurement team's job was to negotiate a slightly better rate every few years. The CFO never saw the bill.
That contract assumed the grid was a regulated monopoly with spare capacity. Both assumptions are gone.
11. The New Exposure Stack
Industrial buyers now sit under a stack of distinct, separately priced risks. Energy charges float with wholesale markets if the contract passes them through. Demand and capacity charges bill the site for its highest contribution to system peak. Ancillary and balancing costs are socialized across the network and rising with renewable integration. Grid tariffs and redispatch surcharges fund the wires and the cost of rerouting power around bottlenecks. Renewables and policy levies fund the transition. And carbon costs arrive via suppliers, via CBAM, or via the plant's own compliance.
表格
| Bill component | What it prices | Direction 2023→2026 | Manageable by a VPP? |
|---|---|---|---|
| Wholesale energy | MWh consumed by hour | Volatile, higher mean | Yes — time-shift / shed |
| Demand charge | Peak kW in a window | Up sharply | Yes — flatten the peak |
| Capacity charge | Reserved availability | Up ~9× in PJM | Yes — reduce contribution |
| Ancillary/balancing | Grid stability services | Up | Partial — can become revenue |
| Grid tariff / redispatch | Wires & congestion | Up | Partial |
| Policy levies | Renewables funding | Mixed | No |
| Carbon / CBAM | Embedded CO₂ | Up | Yes — lower, cleaner load |
The crucial shift: five of these seven components become controllable — and three of them become revenue lines — the moment the factory can dispatch its load against signals. A passive consumer can only watch. A dispatchable asset can act.
12. Spot Prices That Behave Like a Trading Book
The most visceral change is in real-time and day-ahead wholesale prices. In the trailing twelve months to mid-2026, ERCOT recorded 31 days on which real-time prices cleared at $1,000/MWh or higher in some interval, with a peak settlement above **$5,200/MWh**, driven by the combination of hot weather, forced generation outages, and large inflexible data-center load. At the same time, midday solar-rich hours repeatedly cleared near zero or negative, only to ramp violently upward as the sun set — the so-called duck curve producing a few hours of extreme net-demand every evening.
For a flat, inflexible factory, this is pure downside: it happens to be consuming at full power during the expensive evening ramp and cannot capture the cheap midday hours. For a flexible factory, this exact shape is the profit engine — pre-cool, pre-heat, charge storage, and run batch processes through the cheap midday; ease off and discharge through the expensive evening. The same price curve that destroys one plant's margin pays the other plant's retrofit.
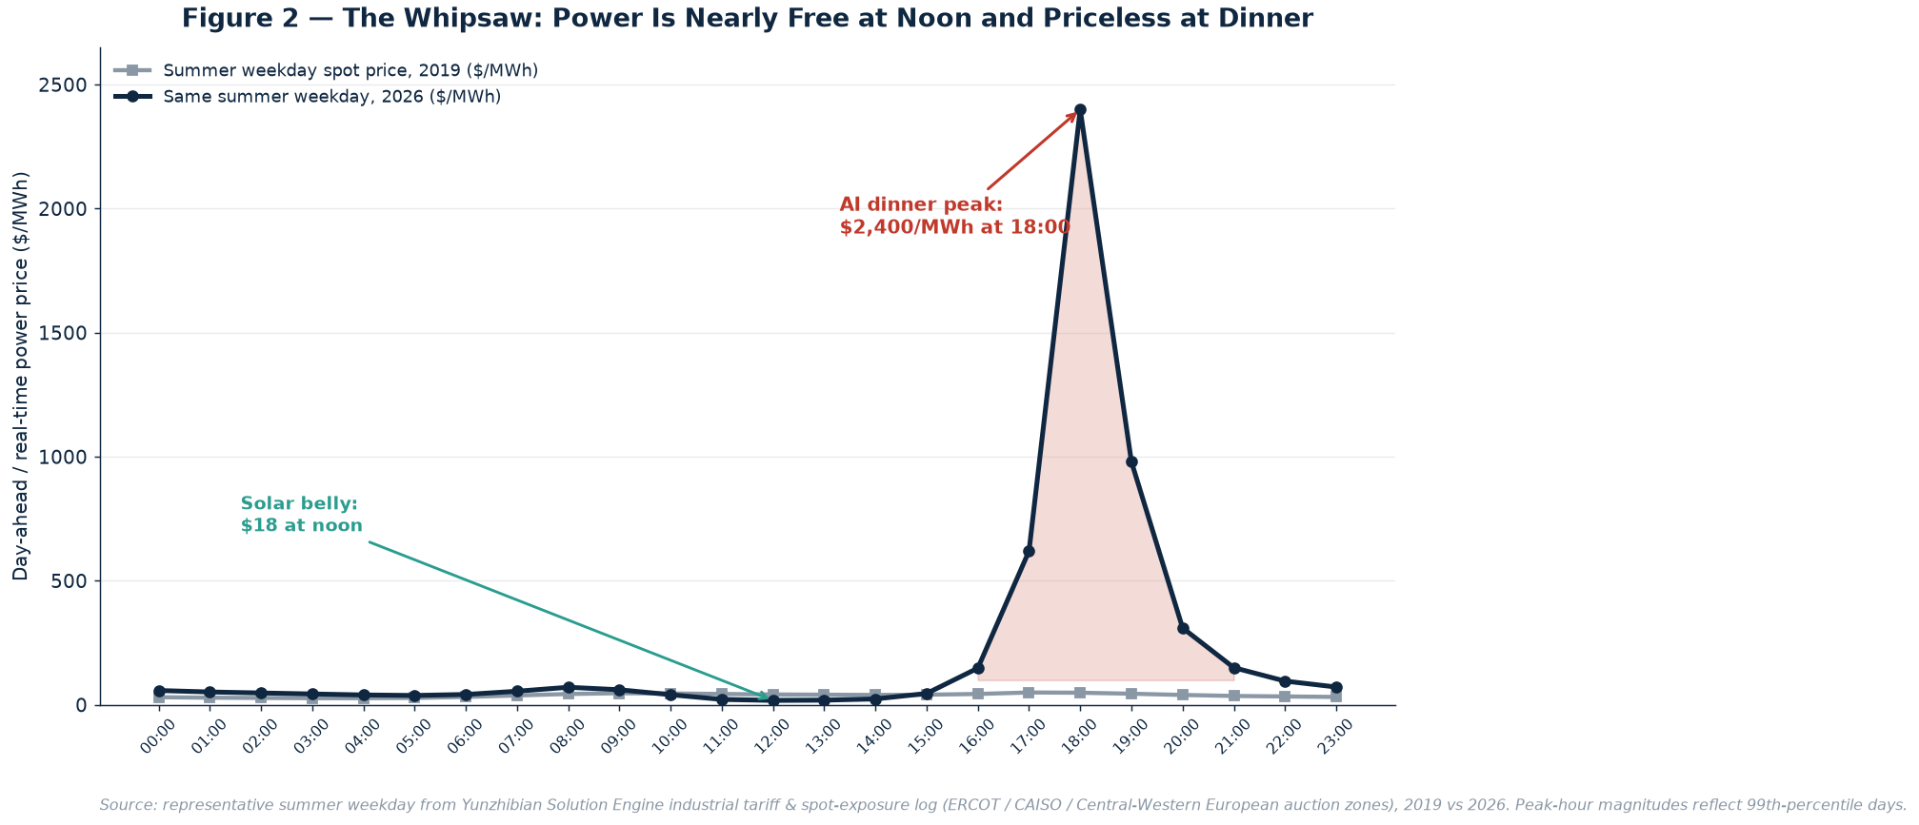
Figure 2 — The Spot-Price Whipsaw: an illustrative extreme day, from near-zero midday prices to a multi-thousand-dollar evening ramp. The inflexible plant buys high; the VPP plant has already moved its energy.
Figure 2 — The Spot-Price Whipsaw: an illustrative extreme day in an exposed market. Prices near zero at the solar midday, a violent evening ramp to multi-thousand-dollar levels. The inflexible plant buys high all evening; the VPP plant has already moved its energy and is paid to be available.
14. The Efficiency Trap
Here is the argument that wastes three years at many companies. Facing higher bills, leadership launches an energy-efficiency program: LED lighting, compressed-air leak repair, motor upgrades, variable-speed drives, perhaps an ISO 50001 management system. These are good projects. They typically remove 5–15% of consumption with acceptable returns. Then the program is declared a success and the energy file is closed.
But efficiency attacks only the volume of energy. It does not touch the timing of consumption (which determines exposure to price spikes and demand charges), the availability the site offers the grid (which determines capacity charges and DR revenue), or the carbon intensity by hour. A plant can become 12% more efficient and still be flat-out at $5,000/MWh during the evening ramp on a September day. Efficiency is necessary; it was never sufficient.
表格
| Lever | Reduces volume | Shifts timing | Monetizes availability | Lowers carbon by hour |
|---|---|---|---|---|
| Lighting/LED | ✓ | — | — | marginal |
| VSDs / motor upgrade | ✓ | partial | — | marginal |
| Leak audits | ✓ | — | — | — |
| ISO 50001 | ✓ (management) | — | — | — |
| Factory VPP | ✓ (when needed) | ✓ | ✓ (revenue) | ✓ (verifiable) |
The VPP does not replace efficiency. It absorbs it: every efficient load is a smaller, cleaner asset to dispatch. But the strategic value lives in timing, availability, and carbon — the dimensions efficiency cannot reach.
15. The CFO's Reclassification
When the CFO finally models the energy line correctly, its nature changes. It is no longer a fixed operating cost to be minimized. It is a position with a natural hedge embedded inside the factory walls. The thermal mass in the process, the schedule slack in batch operations, the pressure band in compressed air, the comfort band in HVAC — these are all latent storage. Storage, paired with a forecast and a market connection, is a trading position. Running it flat is the equivalent of holding an option portfolio and never exercising a contract.
The reclassification has a balance-sheet consequence: the VPP retrofit converts an operating-cost problem into a small capital investment that returns a multi-revenue income stream, with a sub-12-month payback in our reference case. CFOs who cannot get capital approval for "an energy project" routinely approve it once it is presented as "a $340K asset returning $412K in year one."
16. The CSO's Carbon File
For the Chief Sustainability Officer, the VPP resolves a frustration that has dogged Scope 2 reporting for years. Conventional annual renewable-energy certificates (RECs) prove the purchase of clean electrons somewhere on the grid during a year; they do not prove the plant consumed clean power at a specific hour. As grids add large shares of variable renewables, the carbon intensity of a megawatt-hour swings dramatically through the day. A VPP that shifts consumption into low-carbon hours and responds to grid carbon signals produces time-stamped, verifiable load reduction — the granular, 24/7 carbon-aligned data that emerging standards (hourly carbon matching, granular certificates, CBAM substantiation) increasingly demand. It turns the sustainability report from an annual attestation into an operational, auditable stream.
17. The Decision in Front of You
By the end of Part II, the question is no long
解锁后续 88% 内容Unlock the Remaining 88% of Evaluations & the Decision Engine
The second half includes: a core solution cross-comparison matrix, a key parameter selection checklist, an implementation pitfalls guide, and a TCO & ROI calculator for mainstream approaches.
Get Your Custom Solution (View in Dashboard)