2026 Industrial Data Observability: Semantic Edge Gateways Against Data Swamp & Silent AI Failures
2026-10-07 10:03:00
#CEO#Chief Data Officer# CFO#CIO#Chief Enterprise Architect
Executive Summary
Here is the short version, written for the person who does not have time for the long one.
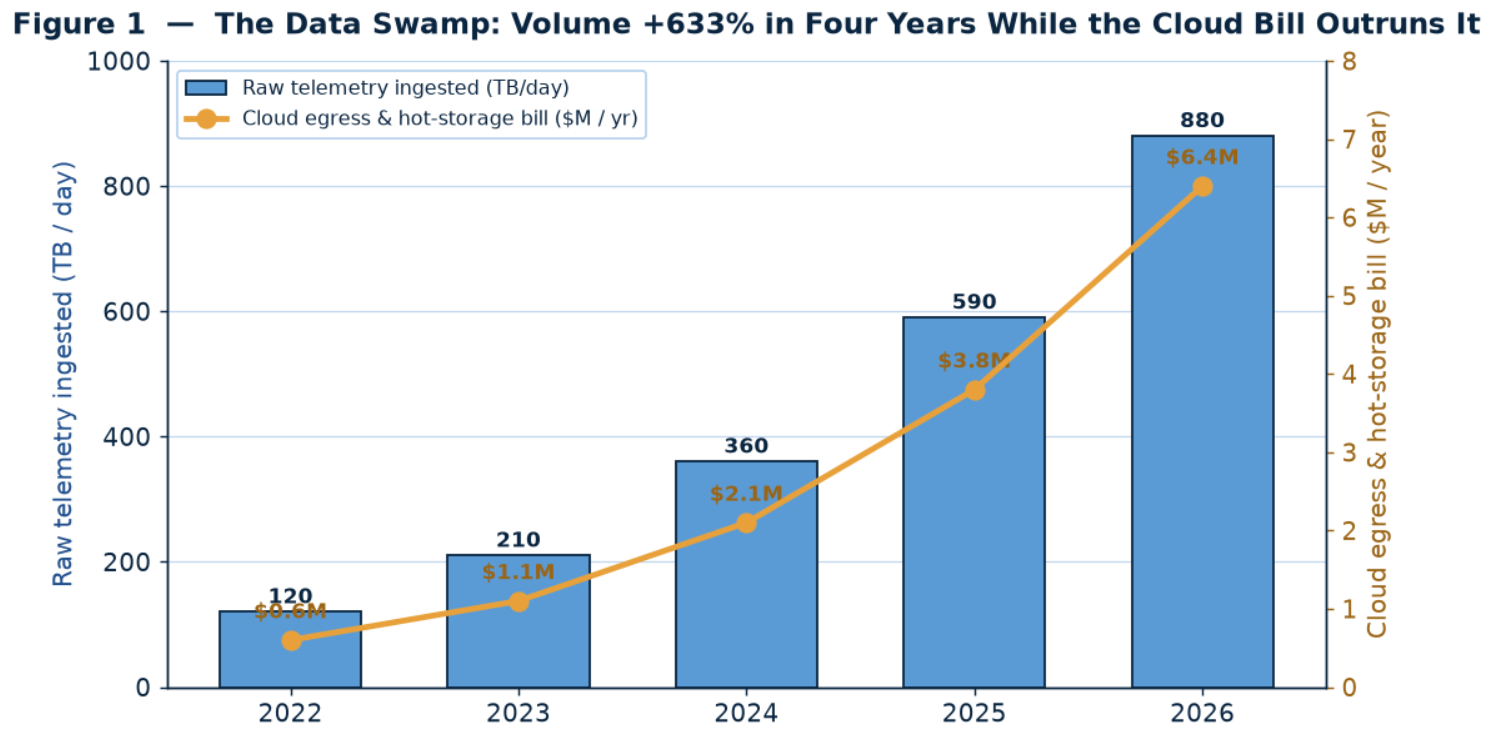
Over the last four years, advanced manufacturers did exactly what every cloud and data vendor told them to do. They instrumented everything. They streamed every PLC tag, every sensor, every vision frame and machine trace up to a cloud data lake. They hired data engineers and data scientists, stood up lakehouses and feature stores, and built AI models on top of the resulting reservoir. The intent was sound. The result, in the majority of sites we walked, was something the teams themselves now call the Data Swamp: an ever-growing pile of raw data that is expensive to move, hard to trust, and silently corrupting the very AI programs it was collected to feed.
Three numbers frame the problem.
The failures are not exotic. A temperature probe drifts two degrees and nobody notices because the pipeline only checks that a number arrives. A historian restarts and replays three hours of old timestamps. A PLC firmware update renames a tag or shifts an engineering unit from bar to psi. A feed that a critical model depends on stops at 02:00 on a Sunday and the dashboards go blank for only one of forty panels, so nobody sees it. In every case the infrastructure is "green" — packets flow, jobs succeed, storage fills — while the meaning of the data has rotted. Traditional monitoring tells you the pipes are up. It cannot tell you that the water is still safe to drink.
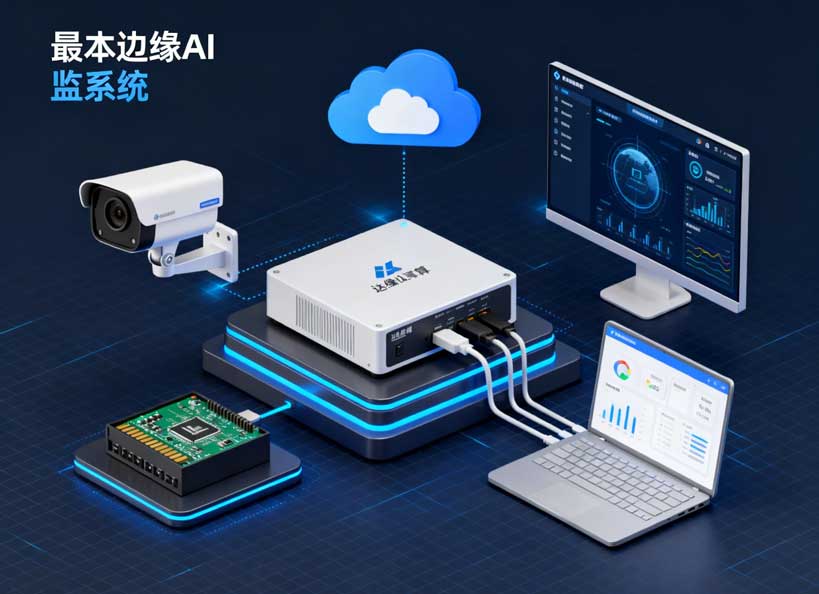
That gap is what industrial data observability closes, and the architectural answer most 2026 leaders are converging on is the Semantic Edge Gateway: a layer placed at or near the source that validates meaning before data leaves the plant, decides locally what is actually worth moving or storing, and runs time-sensitive AI on-site so that only context — not every raw byte — travels to the cloud. The shift is from "collect more and figure it out later" to "validate at the edge, route by value, and trust what crosses the line."
68% of Fortune 500 industrial operators in our dataset now have a semantic-edge or edge-observability program in pilot or production — up from under a quarter two years ago. They are not abandoning the cloud. They are moving the decisions about what data means and whether it is worth moving back to where the data is born.
The reference economics
For a representative multi-plant advanced manufacturer (five to eight sites, a mix of process and discrete operations, an active AI/advanced-manufacturing roadmap), the numbers look like this:
表格Measure Cloud-first / manual baseline Semantic edge observability One-time program cost (12 months) — $480K Annual cloud egress & hot-storage spend $6.4M (reference) cut ~70% on routed streams Annual value (avoided cost + reclaimed capacity) — $690K Cash break-even — 8.4 months Silent AI failures caught at the source 27% 89%+ Mean time to detect a meaning-level fault days / weeks minutes Data-engineer firefighting time baseline down ~62%
The program pays for itself inside three quarters, and the larger return is often strategic rather than line-item: the AI roadmap stops being hostage to data nobody can prove is trustworthy, and the cloud bill stops compounding with every new sensor.
How to read this whitepaper
This is a working document, not a thought-leadership essay. It is organized to be read in order by a leader deciding whether and how to move, and to be mined later by the team doing the work.
One framing runs through the whole paper. You do not solve the data swamp by collecting more data or by buying a bigger dashboard. You solve it by deciding, at the edge and by value, what data means and what it is worth, and by making everything that crosses into a decision or a model provably trustworthy. The technology to do that is mature. The economics are favorable. The remaining variable is timing — and in every site we studied, the teams that waited paid compounding interest to learn the same lesson.
PART I — THE PARADOX OF MORE DATA
1. The promise that started the decade
At the beginning of the industrial-data push, the logic felt unassailable. Data was the new oil. AI models needed large, diverse datasets to learn from. Sensors and connectivity were getting cheaper, cloud storage appeared effectively unlimited, and the cost of not capturing a signal was permanent — once a moment on the line passed, it could never be re-measured. Faced with a choice between storing a tag and possibly never needing it versus not storing it and one day wishing they had, operators rationally chose to capture everything. "Collect now, use later" became the default architecture of industrial digitalization.
2. What actually happened
The prediction that data volume would grow was correct. The prediction that it would cleanly convert into value was not. Four practical realities intervened. First, the cost of moving data out of the cloud — egress — turned out to be a large recurring charge that was rarely modeled when the lake was approved. Second, raw industrial data is messy in ways generic big-data tooling does not anticipate: tags change, units shift, historians replay, feeds flap. Third, the people who understood the physical processes were rarely the same people building the lake, so the meaning of fields was captured imperfectly or not at all. Fourth, AI models turned out to be exquisitely sensitive to subtle changes in their inputs — changes that were invisible to infrastructure monitoring.
3. The latency and cost gap
Consider the reference numbers. A modern plant generates high-frequency process traces, vision and thermal frames, and dense arrays of PLC tags. Streaming the unfiltered full stream to a central cloud and running analysis there creates three costs at once: bandwidth and egress fees, hot storage for data that must be queried quickly, and round-trip latency that makes the data useless for any decision that cannot wait for a network round trip. Meanwhile the decision windows on the floor — adjust a melt pool, correct a dosing setpoint, flag a forming defect — are measured in milliseconds to seconds. Sending everything up and waiting for an answer is not merely expensive; for an expanding class of decisions it is simply too slow.
4. The egress tax nobody budgeted
Cloud egress is the charge incurred when data leaves a provider's network, and it is structured in a way that catches industrial operators off guard. Ingestion — putting data in — is often cheap or free, which makes the first year of a "collect everything" program look affordable. The bill arrives later, when that data must be moved, queried across regions, processed in a different system, or recovered at volume. Teams describe the realization with striking consistency: the storage line item was expected; the egress and cross-region transfer line items were several times larger and grew automatically with every new instrument. A tax that compounds with your own success is a structural problem, not a budgeting oversight.
5. The swamp defined
The Data Swamp is not a storage-capacity problem and it is not solved by a larger warehouse. It is the condition in which an organization holds a vast quantity of raw data it cannot fully trust, cannot cheaply move, and cannot prove still means what its labels say it means — while being billed continuously for the privilege. The swamp is characterized by unused or duplicated datasets, undocumented field semantics, feeds whose health is measured in packets rather than meaning, and a growing gap between the data team's confidence and the process engineers' trust. The painful irony is that the more data an anxious organization pours in, the harder the swamp becomes to navigate.
6. Why "just collect everything" cannot be walked back trivially
Once a collect-everything architecture is operational, walking it back is harder than adopting it was. Downstream models, reports, and integrations grow dependencies on fields that were never formally specified. Nobody is certain which of the thousands of streams are actually consumed, so caution favors continuing to send all of them. Storage and egress costs are diffuse across budgets while the risk of turning a feed off is concentrated on whoever makes the decision. The result is institutional inertia: everyone knows much of the data is unused, expensive, and partly untrustworthy, but no one has a safe mechanism and a clear mandate to change it. That mechanism — and the economic case for it — is what this paper sets out to provide.
PART II — THE ANATOMY OF A SILENT AI FAILURE
7. What "silent" actually means
A conventional system failure is loud. A server crashes, a job fails, a dashboard goes red, an alarm sounds — and someone responds. A silent failure is different: the system keeps running, outputs keep being produced, and the consumers of those outputs keep acting on them, while the data underneath has drifted, decayed, or been reordered. There is no crash to detect because nothing technically broke. The model still returns a confident-looking number. The damage accumulates quietly until it surfaces far downstream as scrap, a quality escape, a wrong setpoint, or a forecast that no one trusts anymore. This is the failure class that makes industrial AI programs quietly fail.
8. Failure mode one: sensor drift
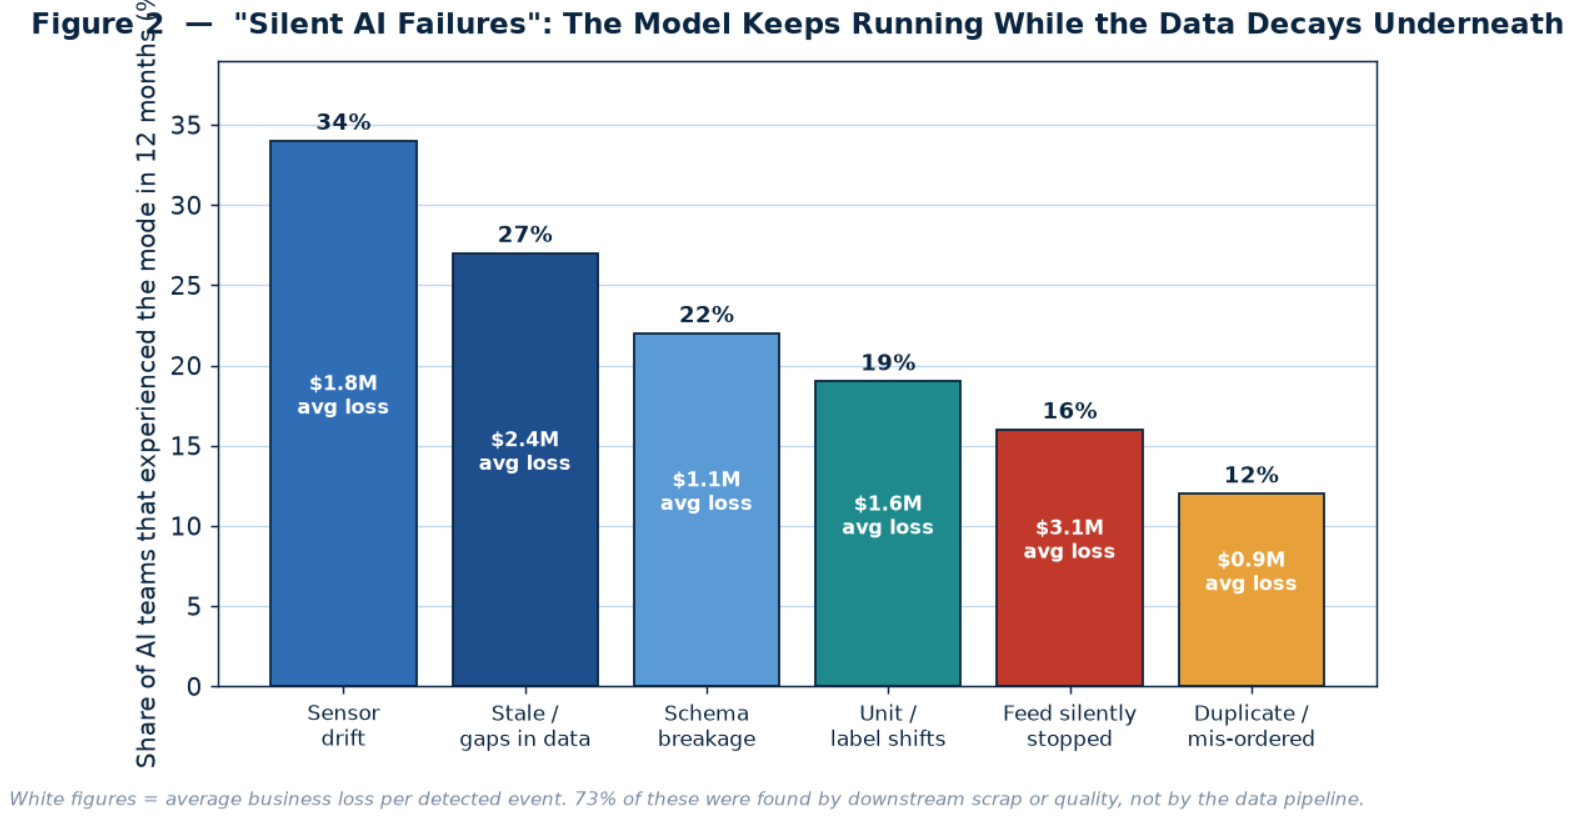
A temperature probe reads two degrees high as it ages. A pressure transducer's zero point creeps. The values remain perfectly plausible — within every range check — and arrive on schedule, so every pipeline health indicator stays green. But a control model or a soft-sensor trained on the true relationship now receives a systematically biased input. In the field, drift was the single most common silent failure, reported by roughly a third of teams, and it is especially damaging because it is slow: the bias grows gradually enough that downstream outputs shift in step and no single day looks wrong.
9. Failure mode two: gaps and stale data
A historian buffers locally during a network interruption and then forwards the backlog. A feed pauses and resumes. From an availability standpoint the data "arrives," but it arrives late, out of real time, or with holes. A model that assumes its inputs describe the current process now reasons about a mixture of present and past conditions. Where gaps are silently filled with repeated or default values — a common convenience in pipelines — the record looks complete while containing fabricated measurements. Detecting this requires checking freshness and cadence against meaning, not merely checking that a row exists.
10. Failure mode three: schema and contract breakage
A PLC firmware update renames a tag. A supplier changes a message format. A column that was an integer becomes a string, or a field that was nullable becomes populated. Loaders built to a fixed contract either reject the change loudly (the relatively lucky case) or, worse, coerce and accept it, quietly mapping a renamed signal into the wrong field or defaulting a missing one. Schema drift is a classic software problem, but in OT it is triggered by physical-world changes engineers make for good operational reasons, with no coordination path to the data team — which is why a semantic contract enforced at the edge matters more than a schema defined centrally and discovered after the fact.
11. Failure mode four: units, labels, and meaning shifts
This is the most insidious family because every technical check can pass while the physical meaning changes. A value reported in bar is interpreted as psi after an engineering-unit change; a temperature logged in Celsius is consumed as if Fahrenheit; a state code's enumeration is reordered so that code "2" means something different. The numbers are valid, the types are correct, the feed is healthy — and the model is now reasoning about a fundamentally different physical quantity. No infrastructure monitor can catch this, because the failure is not in the data's structure but in its relationship to the real process it is supposed to describe.
12. Failure mode five: feeds that silently stop
A critical input feed stops at 02:00 on a Sunday. Across forty dashboard panels, one goes blank or freezes. The pipeline's aggregate health remains green because the platform as a whole is up and most streams flow. By Monday morning the dependent model has been operating on frozen or default inputs for many hours, or its outputs have simply stopped updating without anyone noticing. The failure is "visible" in the narrow technical sense and invisible in the operational sense — a distinction that only a semantic layer aware of which feeds matter, and to which decisions, can resolve.
13. Failure mode six: duplication and mis-ordering
Distributed systems can deliver a message more than once or deliver events out of time order. A counter that increments once per part is double-counted; a time-series model that depends on sequence receives shuffled rows; an aggregation run over duplicated records reports inflated totals. As with stale data, the record can look complete and plausible while being wrong. Detection requires deduplication and time alignment performed with awareness of the physical semantics — which duplicates are genuine retransmissions versus real repeated events, and what the correct ordering implies about the process.
14. Why these failures are found so late
The dominant reason these failures escape detection is architectural: the validation that would catch them is expected to happen far from the source and far downstream of the cost. Raw data is shipped to a central lake, where generic quality checks confirm structural properties — a value exists, a type matches, a job completes — while meaning-level checks are nobody's explicit responsibility. The consumer of the data, often an AI model or an analyst, is the first component that depends on the semantic property that broke, so the consumer is also the first to notice, usually through a consequence. By then the cost has already been incurred, often repeatedly, over the days or weeks the condition persisted.
15. The asymmetry that makes silent failures expensive
Silent failures share a brutal asymmetry: they are cheap to prevent at the edge and expensive to remediate downstream. A validation rule evaluated where the data is born can reject or flag a unit shift, a stale timestamp, or a stopped feed in milliseconds, before the bad value influences anything. The same defect discovered after it has crossed a model, a report, and a business decision requires tracing what happened, determining how long it persisted, recomputing affected outputs, and explaining a quality or financial consequence. The cost ratio is not a few to one; in the traced cases it was commonly hundreds or thousands to one. That asymmetry is the entire economic argument for moving validation to the edge.
16. The compounding effect on AI trust
Beyond direct losses, silent failures impose a strategic cost: they erode organizational trust in AI itself. When a model that was promoted as a flagship capability is quietly corrupted by a two-degree sensor bias and the failure is discovered through scrap, the lesson the broader organization learns is not "our data pipeline needs strengthening" but "these AI systems are unreliable." Funding for subsequent initiatives tightens; process engineers become reluctant to cede authority; data scientists spend their time defending past models rather than building new ones. The single most valuable thing a data-observability program protects may therefore be the credibility of the entire AI roadmap — restoring the condition under which models can be trusted enough to be given real responsibility.
PART III — WHY INFRASTRUCTURE MONITORING IS NOT ENOUGH
17. What traditional monitoring was built to answer
Conventional IT and data monitoring answers a well-defined set of questions about infrastructure: Is the server up? Is the process running? Is CPU, memory, or disk within bounds? Did the batch job succeed? Is the network reachable? Are messages flowing at the expected rate? These are necessary questions, and the tooling that answers them is mature. The entire discipline assumes that if the machinery is functioning and data is moving, the system is healthy. For systems that merely transport and store data, that assumption is reasonable. For systems whose outputs drive physical and business decisions, it is dangerously incomplete.
18. The green-dashboard problem
Teams consistently describe the same disorienting experience: every monitoring dashboard on the wall is green — jobs succeeding, pipelines flowing, storage nominal — at the exact moment a model is producing wrong answers because an input changed meaning. Infrastructure metrics are not merely failing to flag the problem; in a psychological sense they are actively reassuring the team that no problem exists. The more polished and centralized the monitoring, the stronger the false reassurance. An operator seeing all-green has been told, by an authoritative system, that things are fine, which delays the very human suspicion that is the only remaining detection mechanism.
19. From monitoring pipes to validating meaning
The conceptual leap required is to move observability one level up — from the infrastructure that carries data to the meaning the data represents. Meaning-level observability asks a different set of questions: Does this value still represent the same physical quantity it did last week? Is it within the bounds the real process can plausibly take? Is it fresh relative to the decision that consumes it? Does it agree with the related signals that should move with it? Has the contract that defines its semantics been honored? These questions cannot be answered from network or process telemetry. They require an explicit model of what the data is supposed to mean — a semantic contract — evaluated against the real behavior of the source.
20. The maturity spectrum
Organizations progress, unevenly, through recognizable stages. Most begin by collecting everything into a central lake. They then add dashboards and threshold alerts that react after problems occur. More mature teams add pipeline monitoring — up/down, throughput, lag — which gives visibility into the movement of data but not
解锁后续 88% 内容Unlock the Remaining 88% of Evaluations & the Decision Engine
The second half includes: a core solution cross-comparison matrix, a key parameter selection checklist, an implementation pitfalls guide, and a TCO & ROI calculator for mainstream approaches.
Get Your Custom Solution (View in Dashboard)