2026 RxM Whitepaper: Predictive Dashboards Are Dead — Edge AI for Machine Self-Healing & Zero Unplanned Downtime
2026-10-20 20:10:00
#CEO#COO#VP of Reliability Engineering#Chief OT Architect#CFO
Executive Summary
You probably already own a "predictive maintenance" program. The uncomfortable question this whitepaper asks is whether it changed anything on the shop floor — or whether it mostly produced a dashboard that people stopped trusting.
Our field work across 360+ advanced-manufacturing and R&D sites in North America and Europe during 2025-2026 reached a conclusion that is blunt even by our standards: the majority of predictive-maintenance (PdM) deployments stall at the point where value actually begins. They detect. They predict. They throw an alert onto a screen. Then a human — overloaded, on shift change, unsure whether the alarm is real — does nothing. The machine fails anyway. The program is quietly judged expensive, and reliability quietly returns to the calendar and the breakdown truck.
The gap is not better prediction. The gap is the loop from signal to sanctioned action. Prescriptive Maintenance (RxM) closes that loop: instead of telling a person that something might fail, the system decides what should be done, by when, at what cost, and with what confidence, and — inside a tightly validated safety and spending envelope — either performs or triggers the action itself. The machine throttles itself before a bearing seizes. A work order is generated before a pump fails. A spare part is reordered before the stockout, not after the downtime.
This is not science fiction run amok. It is a staged, audited, guardrailed control pattern in which autonomy is earned one failure mode at a time and the machine is always free to defer to a human.
What the field data shows
The following figures are drawn from the site audit set described in our methodology notes. We present them as directional ranges for a typical advanced-manufacturing site rather than as guarantees for yours; Appendix D shows how to recompute every number against your own asset register.
表格
| Finding | Field result | Why it matters to the board |
|---|---|---|
| PdM alerts that are ignored or closed without action | ~70% | Most programs pay for detection but never convert it to avoided downtime |
| Sites where the PdM tool produced a dashboard but no owned action workflow | 61% | "Prediction with no action" is the dominant failure shape |
| PdM programs that fully reached their original ROI target | ~19% | Predictive maintenance as commonly sold has a credibility problem |
| Fully-loaded cost of one unplanned downtime hour (range) | $95k-$340k | A single avoided event in a critical asset often pays for a pilot |
| Fortune 500 manufacturers piloting or scaling RxM / closed-loop causal AI | 70% | The move from passive dashboards to action is already mainstream |
| Reduction in unplanned downtime hours after a mature RxM program | ~60-70% | This is the number that changes an operating review |
| Spare-parts inventory carrying cost reduction | ~30-35% | Auto-reorder against real RUL releases trapped working capital |
| Typical program investment / year-one value / payback | ~$430K / ~$690K / ~9 months | Sub-year payback on a single critical asset class |
Five arguments carry this paper:
How to read this whitepaper
Part I diagnoses the broken promise of predictive dashboards. Part II sizes the downtime tax. Part III explains why alert fatigue and correlation-only models fail. Part IV defines the six-layer closed-loop RxM stack and the autonomy line. Part V gives the six-step build-and-deploy method. Part VI builds the economic case. Part VII is a worked 20-millisecond-to-work-order walk-through. Part VIII presents four field cases. Parts IX-XI cover governance, organization, and a 90-day start with a five-year view. Parts XII-XIII are the engineering deep dive and the leadership playbook. Appendices A-F provide the SKU catalog, failure-mode library, validation checklist, ROI model, glossary, and RFP language.
A note on tone and evidence. We have an opinion and we are not hiding it: passive predictive dashboards are a dead end as currently deployed, and the future belongs to guardrailed, causal, closed-loop maintenance. But every recommendation here is one we would stake an engineering reputation on, and we show the assumptions so you can disagree with the math rather than the marketing.
PART I — THE DEATH OF THE PREDICTIVE DASHBOARD
1. The demo that always works and the shift that never changes
Every predictive-maintenance sale follows the same script. A confident team stands in front of a dashboard glowing green, amber, and red. A failing bearing is flagged days in advance. Executives nod. The business case writes itself: if we catch even a fraction of failures early, the tool pays for itself many times over.
Then it meets reality. On a real shift, with real operators and a real backlog, the amber lights proliferate. Some are real, some are sensor noise, some are already-known, and nobody can tell which is which at 3 a.m. The dashboard is still glowing, but the plant is still fixing things after they break. The vendor is long gone, the success metrics have quietly shifted from "downtime avoided" to "alerts generated," and another digital initiative has joined the graveyard of things that looked obvious in a slide deck.
2. Detection is not an outcome
Here is the conceptual error baked into the entire category. A prediction is information, not action. "This motor has an 80% probability of failure within the next fourteen days" creates value only if the world changes in response: a work order is scheduled into a planned window, a bearing is ordered, a load is reduced, a technician is dispatched with the right part on the right day. If none of that happens — if the alert merely joins the queue — the prediction's economic value is precisely zero, while its costs (sensors, platform, the time spent glancing at it) are very real.
The software industry sold detection as if conversion were automatic. It is not. It is the hard part.
3. The three silos that eat the prediction
In most plants the prediction dies in the gap between three functions that do not report to each other.
Each function is acting rationally against its own incentives. The prediction falls into the seam between them. No individual is at fault; the system is designed to drop the ball.
4. What the audits actually found
When we audited the installed base rather than the reference accounts, a consistent pattern emerged. Most sites had bought a credible product, instrumented a credible set of assets, and trained a credible model. The failures clustered almost entirely downstream of the model: no clear owner for each alert, no sanctioned response procedure, no integration to the work-order system, no feedback loop telling the model whether its prediction was right, and no authority for anyone to act at 2 a.m. without waking a manager.
In other words, the AI was not the weak link. The loop was the weak link.
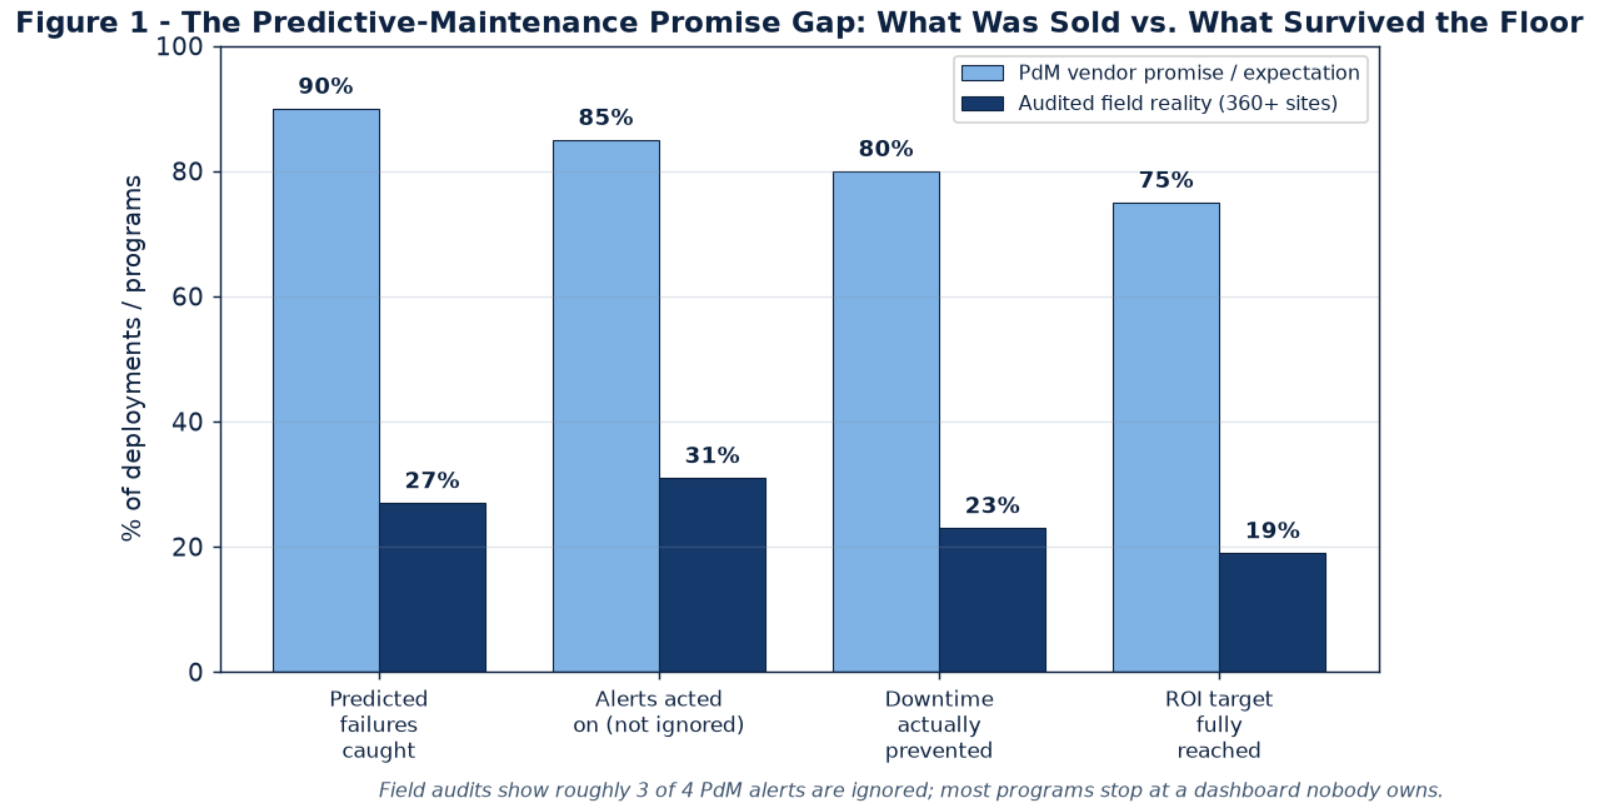
5. CHART1
6. The promise gap in one sentence
Figure 1 makes the central point of this paper without a single additional word: the expectations sold for predictive maintenance and the results that survived contact with the factory floor are separated by a chasm, and that chasm opens at exactly the point where a human was supposed to turn a prediction into an action. Close that point, and the rest of the technology stack — which most of you have already paid for — suddenly becomes worth what you were promised.
7. Prescriptive Maintenance defined
We use precise terms because the category is already being muddied by rebranding.
The differentiator is not smarter alarms. It is the presence of an engineered, owned, guarded path from signal to action.
8. Why "just add more AI" is the wrong answer
A common reaction to a stalled PdM program is to buy a more impressive model — more machine learning, more data sources, a fancier control tower. This doubles down on the half of the problem that is already working while leaving the broken half untouched. A 95%-accurate prediction that nobody acts on is worth less than a 70%-accurate one that is reliably converted into a scheduled intervention. The marginal dollar belongs to the loop, the workflow, the guardrails, and the ownership model — not to another detection algorithm.
9. The stakes rose while the category stalled
The cost of being bad at this is increasing even as the old category stagnates. Plants run leaner, margins are tighter, lead times for critical spines stretch into months, and a single unplanned line stop in automotive or semiconductor production now costs enough in one hour to fund an entire RxM pilot. The assets are more instrumented than ever, the edge hardware is cheaper than ever, and the causal-AI methods are genuinely better. Everything is in place except the decision to close the loop.
PART II — SIZING THE DOWNTIME TAX
10. Unplanned downtime is a P&L line you already have but rarely see whole
Most organizations track downtime in fragments. Maintenance knows repair costs. Operations knows lost units. Procurement knows expediting charges. Quality knows scrap. Finance knows penalty clauses. Nobody routinely adds them up into a single fully-loaded figure, which is convenient, because the figure is alarming.
11. The fully-loaded cost stack
A defensible hourly cost of unplanned downtime includes at least:
表格
| Cost component | What it captures |
|---|---|
| Lost contribution margin | Product that cannot be sold or must be deferred |
| Direct repair labor | Overtime, call-outs, troubleshooting |
| Collateral damage | Secondary failures caused by the primary event |
| Scrap and rework | Material in process at the moment of the stop |
| Expediting | Premium freight and broker pricing on emergency parts |
| Startup waste | Rejected production while the line restabilizes |
| Contractual penalties | Late-delivery and service-level exposure |
| Customer and reputational cost | Expedited relationships, future orders lost |
12. CHART2
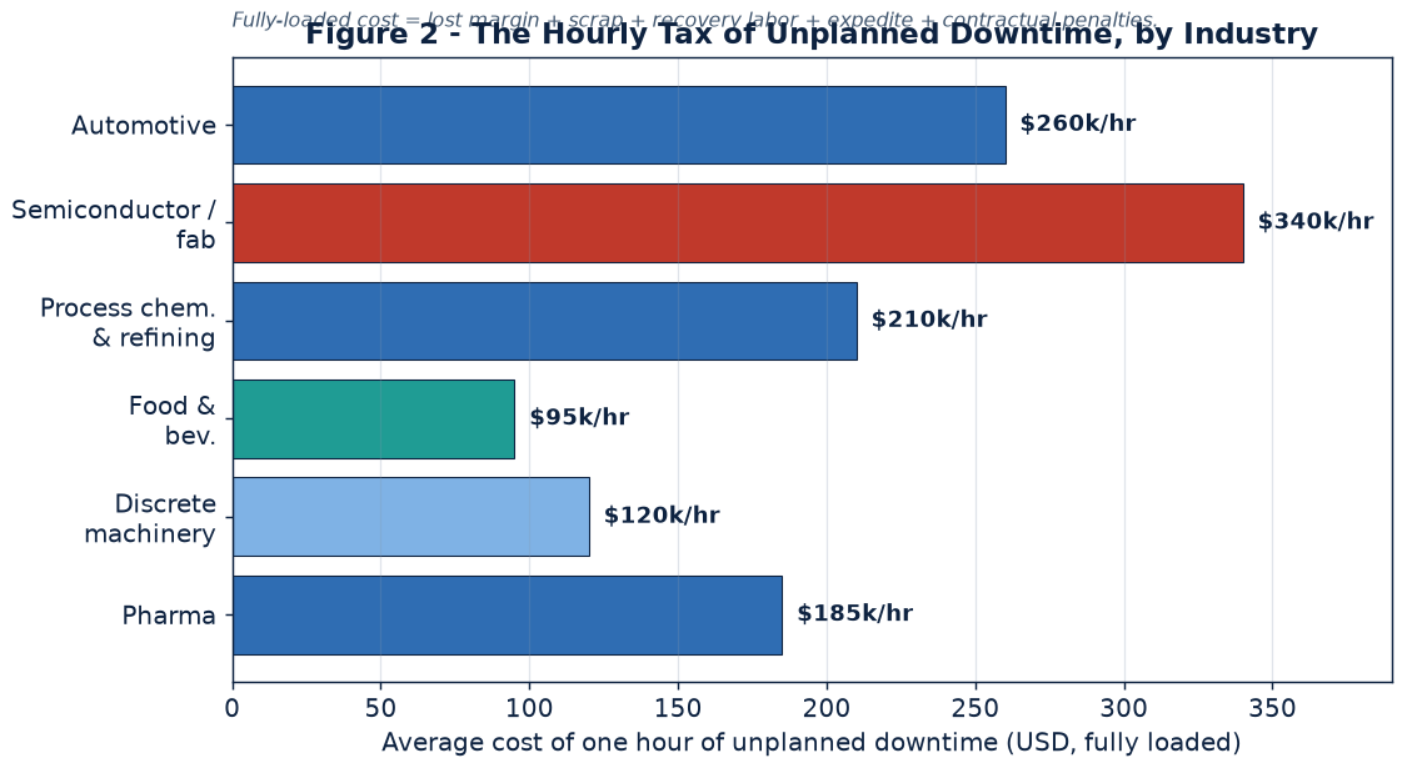
13. Reading the industry spread
Figure 2 shows why the business case begins with asset criticality rather than technology. In semiconductor and continuous-process operations, a single unplanned hour can erase a third of a million dollars; in lighter discrete contexts the number is lower but the events are more frequent. The right opening move is always the asset class where the product of failure probability, fully-loaded hourly cost, and detectability is highest — which is exactly what the selection quadrant in Figure 7 formalizes.
14. Frequency and duration are both enemies
The cost is not just event size; it is also event shape. Short, frequent stops destroy throughput and operator confidence through a thousand cuts; long, rare events destroy quarters and customer relationships. A mature RxM program attacks both: it prevents the long tail of catastrophic failures by catching degradation early, and it suppresses the chronic micro-stops by removing the conditions that cause them. Averaging the two into a single MTBF figure hides exactly the structure you need to act on.
15. The cost you do not see: capacity planning
Recurrent unplanned downtime also forces planners to buy capacity insurance — buffer inventory, surplus equipment, inflated lead-time promises, and contingency headcount. This "ghost capacity" rarely appears on the downtime report but is one of the largest balance-sheet effects of poor reliability. When a board asks why the plant carries so much finished-goods inventory relative to peers, an honest answer often points here.
16. The board framing
For a CEO or CFO, the clean framing is this: unplanned downtime is a self-inflicted, partially preventable tax that the organization is already paying in full, invisibly, every single day. RxM does not create a new benefit out of thin air; it makes a tax you are already paying smaller, and it shows the receipts.
PART III — WHY PREDICTIVE ALERTS FAIL: ALERT FATIGUE AND CORRELATION
17. The human attention budget is the hard constraint
A control-room operator has a finite, small, exhaustible budget of genuine attention. A monitoring program that generates hundreds of low-precision notifications per shift does not produce hundreds of responses; it produces a learned reflex to dismiss. This is not a training gap or a discipline problem. It is a predictable, well-documented response of competent humans to a signal environment where the base rate of actionable truth is low.
18. The precision spiral
Here is the vicious loop that kills credibility. False alarms train operators to ignore alerts. Ignored alerts mean real failures are missed. Missed failures are used to argue the tool is not sensitive enough. Sensitivity is raised, generating more false alarms. Trust drops further. Within a few months the dashboard is on a monitor nobody looks at, and the sponsor quietly stops reporting its metrics. The only way out of the spiral is to reduce the number of things that reach a human to the small set that are both credible and require human judgment — and to have the machine quietly handle the rest or suppress noise entirely.
19. Correlation tells you something is wrong; causation tells you what to do
A model built purely on statistical correlation can be excellent at saying "this pattern usually precedes failure." It cannot safely say "do this." To prescribe an action, the system must reason about the mechanism: is this elevated vibration a bearing defect, a misalignment, a resonance excited by a nearby machine, a loose accelerometer, or a transient process upset? Each cause implies a different action. Acting on correlation alone risks the worst outcome in industrial control — a confident intervention that makes things worse.
20. Causal AI in the maintenance context
Closed-loop causal AI combines three layers of knowledge:
By jointly inferring the failure mode rather than only a risk score, the system can attach a specific cause to a prediction — and therefore a specific, defensible action with a confidence bound.
21. False confidence and the rare-event problem
Failure data is intrinsically imbalanced: a healthy asset produces millions of normal samples and a handful of failure examples. Pure data-driven approaches therefore overfit to the failures they have seen and fail catastrophically on novel ones. Causal structure — what the physics says must happen when a lubrication film collapses, for instance — extrapolates into rare events far more safely than pattern matching alone. This matters enormously the moment you let the machine act, because the action is most dangerous precisely in the novel situation the correlator has never seen.
22. CHART3
23. The maturity spectrum, honestly located
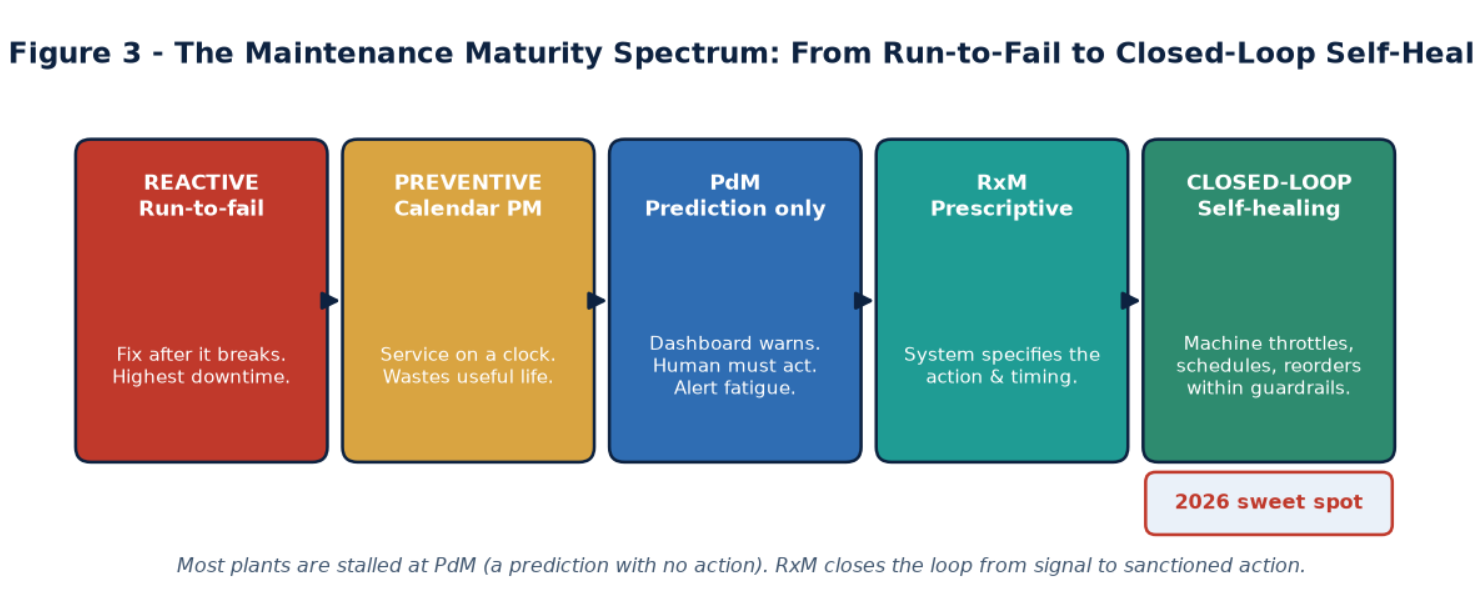
Figure 3 places a typical plant on the reliability spectrum. Almost every sophisticated manufacturer we audited has moved past pure run-to-fail and most have installed calendar-based PM. A large number have deployed some form of predictive monitoring — and then stalled there, in the PdM zone, wondering why the ROI deck never materialized. The two zones to the right — prescriptive and closed-loop — are where the avoided downtime is actually captured, and they are the subject of the rest of this paper.
PART IV — THE SIX-LAYER CLOSED-LOOP RxM STACK
24. Architecture philosophy: local, layered, and always able to defer
Before naming the layers, three design commitments are worth stating because they shape everything downstream.
25. CHART4
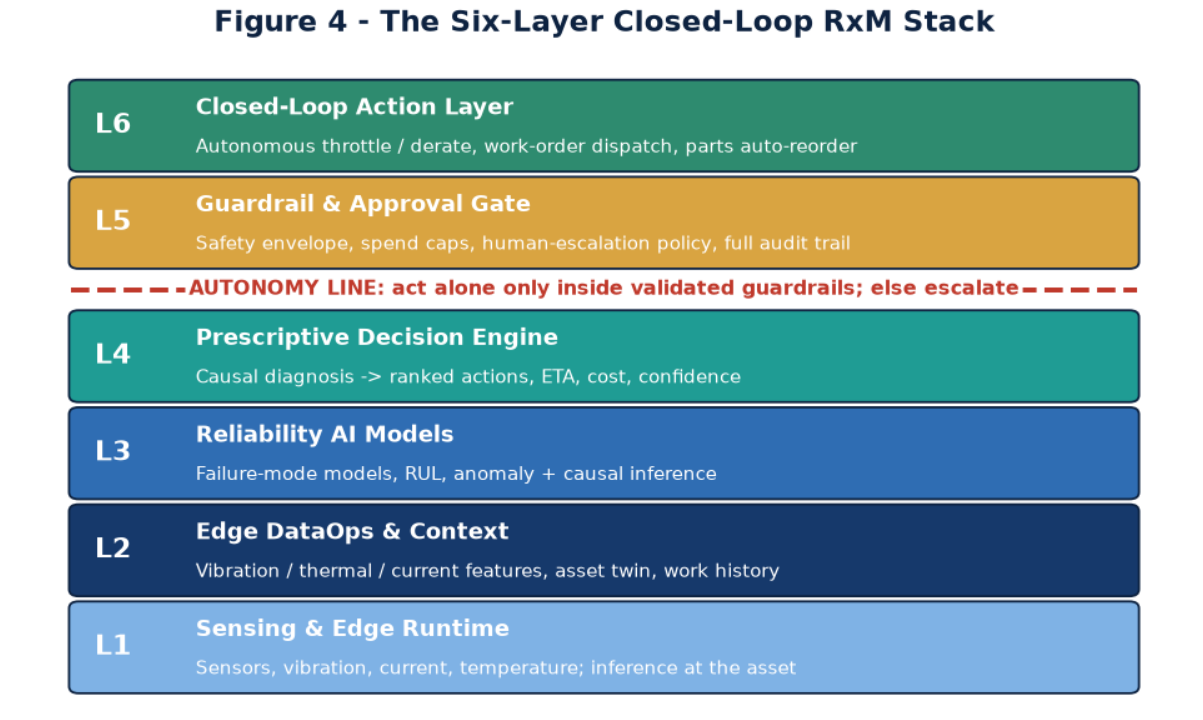
26. Layer 1 — Sensing and edge runtime
The foundation is ruggedized, time-synchronized sensing — vibration, current, thermal, pressure, acoustic — feeding a local edge runtime that can stream high-rate data, compute features, and host the models and control hooks. This layer is deliberately dumb about business decisions and extremely serious about deterministic timing and physical isolation from the safety controller.
27. Layer 2 — Edge DataOps and the asset digital twin
Raw signals are cleaned, contextualized against a live model of the asset (configuration, duty cycle, maintenance history, parts installed), and turned into a trustworthy state representation. This is the layer that answers "what is this machine right now," including the unglamorous but decisive work of rejecting bad sensor data before it contaminates a decision.
28. Layer 3 — Reliability AI: RUL, anomaly detection, and causal diagnosis
Three model families operate here: remaining-useful-life estimation, anomaly detection against learned normal behavior, and the causal diagnostic that identifies the actual failure mode. The output is not a single red light but a structured diagnosis: likely inner-race bearing fault, 78% confidence, estimated 9-15 days to functional failure, propagating via path X.
29. Layer 4 — The prescriptive decision engine
Given the diagnosis, this layer
解锁后续 88% 内容Unlock the Remaining 88% of Evaluations & the Decision Engine
The second half includes: a core solution cross-comparison matrix, a key parameter selection checklist, an implementation pitfalls guide, and a TCO & ROI calculator for mainstream approaches.
Get Your Custom Solution (View in Dashboard)