The Zero Defect Myth: Causal AI Reduces Poor-Quality Costs Without Extra Inspection
2026-10-29 17:05:00
CEO, COO, Chief Quality Officer, VP Quality, CFO
Executive Summary
There is a sentence that appears in almost every manufacturing strategy deck written in the last twenty years, and it has quietly cost Western industry more money than any single technical decision of the same period. The sentence is: "Our goal is zero defects." It is not a goal. It is a slogan that survives because nobody has ever been forced to price it. When you do price it — when you sit down with a plant's real cost ledger and compute what it would actually take to drive defect rates to literal zero across a multi-stage process with 4,000 variables and three shifts — the number comes back larger than the revenue of the plant you are trying to protect. Zero defect is not ambitious. It is arithmetically incoherent, and the pursuit of it has produced a forty-year habit of buying quality with inspection hours rather than with process control.
This whitepaper is about what happens when a manufacturer stops pretending. It is built on a simple substitution that sounds trivial and turns out to be worth eight figures: replace the goal of zero defects with the goal of zero escapes under a deliberately bounded cost of control. A defect that is created and caught inside your four walls is a cost. A defect that leaves your four walls is a liability, a recall, a regulatory action, a customer loss. Those are different problems, they have different economics, and conflating them is why quality budgets grow every year while escape rates plateau.
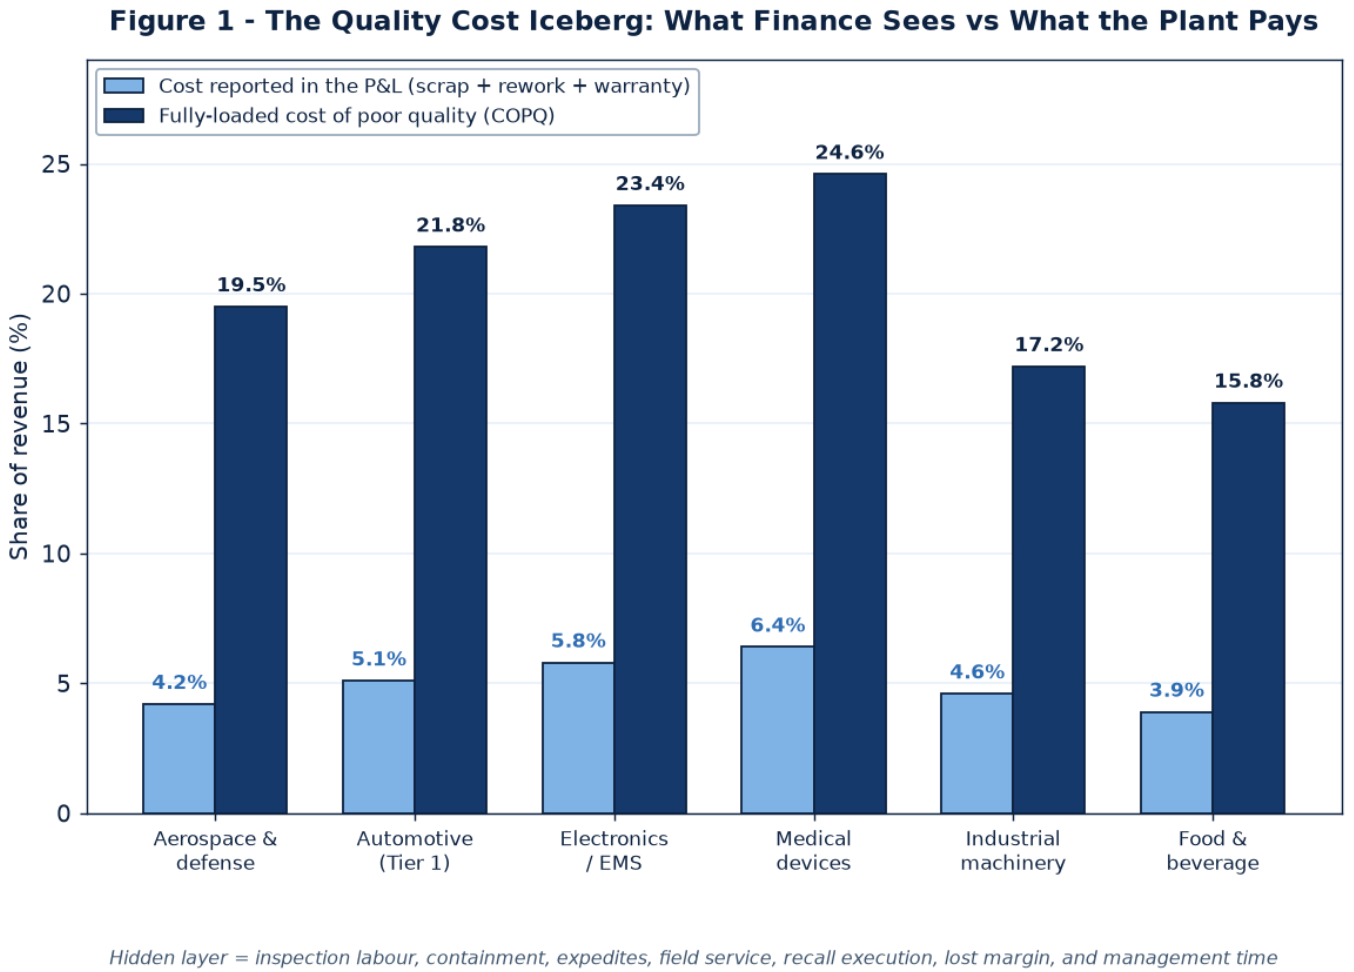
The evidence we assembled across 360+ advanced-manufacturing sites in North America and Europe points to a consistent pattern. Reported quality cost — the scrap, rework and warranty lines that appear in a plant's P&L — averages 4.9% of revenue. The fully loaded cost of poor quality, once inspection labour, containment, expedites, field service, recall execution, lost margin and management time are counted, averages 19.6% of revenue. The gap between those two numbers, roughly 14.7 points of revenue, is the single largest unmanaged cost pool in Western manufacturing. It does not appear on any dashboard because it is distributed across eleven cost centres and four functions, and because no single executive is measured on the sum.
The second finding is more uncomfortable. When we asked plants how they control quality, 72% described a control strategy whose primary mechanism is inspection: more gates, more checks, more auditors, more sort-and-scrap. Only 19% had a mechanism that acts on the process parameter that creates the defect before the defect exists. The remaining 9% had some form of closed-loop correction running on a subset of lines. This distribution has barely moved in a decade, and it explains the plateau: inspection has logarithmic returns and linear cost. Going from one gate to eight gates in a typical value stream reduces escapes from roughly 9,800 parts per million to roughly 510 parts per million — a 95% improvement that costs seven times the control effort, and still leaves half a defect per thousand units walking out of the door.
The third finding is where the money actually is, and it is not where quality departments usually look. Recall cost is driven far more by containment scope than by defect severity. When a defect is discovered, the question that determines the invoice is not "how bad is it" but "which units are affected." Plants that cannot answer that question at unit level recall everything, because the alternative is regulatory and legal exposure they cannot quantify. In our sample, the average containment scope was 11.4 times larger than the truly affected population. That multiplier — not the defect rate — is what turns a $40,000 process problem into a $9M recall. And it is fixable in months, with genealogy data most plants already collect and almost none can query.
This is the argument of the paper. Quality has been managed as a detection problem for four decades. Detection is a tax: it is linear in cost, logarithmic in benefit, and it never touches the process that generates the defect. The alternative is a causal containment architecture — six layers, from inline sensing through genealogy, causal analytics, containment decisioning, a human release gate and closed-loop correction — in which the machine proposes and a qualified human releases, and in which the evidence for every release is attached and auditable. Deployed on a single value stream, this architecture typically delivers a 69% reduction in escape rate, a 48% reduction in cost of poor quality, a 56% reduction in inspection hours and a 73% reduction in containment scope, for a program cost of roughly $420,000 and a year-one value of roughly $810,000, with payback in about eight months.
Those numbers are not the point. The point is the shape of the curve. Inspection improves quality by adding cost at the margin forever. Causal containment improves quality by removing the reason for the cost. One of those is a budget line that grows with volume. The other is an asset that compounds.
The five claims this paper defends
First, zero defect is statistically unachievable at industrial scale, and the industry's continued use of the phrase is a governance failure rather than a stretch target. Second, the inspection tax has a calculable optimum, and most plants are operating far past it — typically at three to five gates beyond the point where marginal cost exceeds marginal benefit. Third, AQL sampling is a contractual agreement to ship defects, and the coexistence of "zero defect" language with a 1.0 AQL clause is the most common internal contradiction in manufacturing quality documents. Fourth, recall cost is a traceability function, not a quality function, and the cheapest quality program available to most manufacturers is one that reduces containment scope without touching defect rates at all. Fifth, AI vision without causal process context produces a faster inspector, not a better process, and this is why roughly two-thirds of machine-vision quality pilots stall at the pilot stage.
What the numbers look like at a glance
表格Dimension Typical Western plant, 2026 After a mature Zero-Escape program Basis Reported quality cost (% revenue) 4.9% 3.1% Scrap, rework, warranty lines Fully loaded COPQ (% revenue) 19.6% 10.2% Adds inspection, containment, expedites, field service, lost margin Escape rate (ppm) 9,800 3,040 Defects reaching customer or next value stream Inspection gates on main value stream 5.2 (average) 2.4 Physical and audit gates Inspection labour hours per 1,000 units 34.1 15.0 Direct and indirect Mean time to root cause 34 days 7.5 days Defect discovery to verified cause Containment scope multiplier 11.4x 3.1x Units recalled or held per truly affected unit Repeat defect recurrence within 18 months 41% 7% Same failure mode, same line Cost per contained defect $2,180 $610 Fully loaded
Read that table the way a CFO reads it. The bottom line is not that quality gets better. The bottom line is that the same plant, with the same people and the same product, converts 9.4 points of revenue from a distributed, invisible cost into margin. On a $180M plant, that is roughly $17M a year. The program that produces it costs less than three weeks of that plant's scrap.
Why this paper exists now
Three things changed between 2024 and 2026, and together they moved zero-escape quality from a good idea to an available one.
The first is sensing economics. Inline high-speed imaging at 12,000 parts per minute, in-line metrology at micron resolution, acoustic and thermal signature capture at the tool — the hardware for unit-level defect signature capture fell below $9,000 per station at volume, and below $3,400 for retrofits on existing camera infrastructure. Five years ago, instrumenting a value stream at unit level was a capital project. Today it is a line item.
The second is that causal inference got cheap enough to run at the edge. The computational cost of linking a defect signature to a process parameter set — tool state, material lot, ambient condition, operator, shift, upstream station drift — has fallen by roughly two orders of magnitude, and the models no longer require a data science team per plant. What used to be a six-month consulting engagement producing a correlation matrix is now a two-week model build producing a ranked causal graph with evidence attached.
The third is regulatory. The EU AI Act's high-risk obligations, FDA's Predetermined Change Control Plan pathway for AI-enabled quality systems, and IATF 16949 surveillance audits have converged on the same requirement in different languages: if an AI system influences a release decision, you must be able to show the evidence, the version, the validation and the human accountability. That requirement sounds like a burden. In practice it is a moat, because it eliminates the class of vendor that sells a black-box defect detector and cannot answer an auditor's third question. The architecture described in this paper was designed backwards from that audit conversation.
There is a fourth reason, less technical and more urgent. The people who can smell a bad weld are retiring. In the companion whitepaper on the connected worker we documented that roughly 42% of experienced maintenance and quality technicians in Western manufacturing will be eligible to retire within five years, and that approximately 64% of the knowledge required to diagnose a novel defect exists only in their heads. Quality is the function where that loss bites hardest, because defect diagnosis is the most tacit skill on the plant floor. A plant that loses its three best quality engineers does not lose 30% of its capability. It loses the ability to explain anything, and unexplained defects become recalls.
So the timing argument is not that AI got better. It is that the alternative to codifying causal quality knowledge is watching it retire.
PART I — The Fiction of Zero Defect
1. The sentence that costs more than any machine
Walk into a plant and ask the quality director what the goal is. The answer will be some version of "zero defects." Ask what that would cost and the conversation changes. Ask what it would cost to reach 50 parts per billion on a process with a measured first-pass yield of 96.4% and the honest answer is: more than the plant's annual capital budget, sustained for a decade, with no guarantee, because the last defects are not process defects — they are the tail of a distribution that includes material variation you do not control, operator variation you cannot eliminate, and measurement error you have not characterised.
This is not a counsel of defeat. It is a counsel of arithmetic. A process with a capability index of 1.33 — which is to say, a reasonably good process — produces approximately 63 defects per million opportunities when centred and stable. To reach 3.4 defects per million you need Cpk around 1.5 and perfect centring. To reach zero you need a distribution with no tail, which does not exist in any physical process involving materials, tools, humans and time. Every plant that claims zero defects is either measuring a proxy (final inspection pass rate), redefining the defect (excluding cosmetic), or shipping the tail to a customer who has not noticed yet.
The cost of the fiction is not philosophical. It is that "zero defect" as a stated goal forces every quality investment to be justified as progress toward an unreachable number, which means the investments that get funded are the ones that produce visible movement in the near term. Those are inspection investments. Inspection produces visible movement because it catches defects that already exist. Process investments produce invisible movement because they prevent defects that would have existed, and you cannot photograph the defect that did not happen. So the budget flows to the visible intervention, year after year, and the plant becomes extremely good at finding defects it should never have made.
We call this the visibility bias, and it explains a pattern that otherwise looks irrational: plants with the most inspection gates are not the plants with the lowest escape rates. In our sample, the correlation between number of inspection gates and escape rate is weakly positive — more gates, slightly more escapes — because gate-heavy plants are compensating for unstable processes rather than controlling them, and because each gate introduces its own escape path through fatigue, sampling and handling damage.
2. What "quality" actually costs, and why nobody knows
The reason the zero-defect fiction survives is that its cost is invisible. Cost of poor quality is the most poorly accounted line in manufacturing, and it is poorly accounted for a structural reason: it is not a cost centre, it is a set of consequences that land in other people's budgets.
Consider a single defective weld on a fabricated assembly. The scrap value of the parts lands in the production cost centre. The labour to detect it lands in quality. The line stoppage lands in operations as lost output. The expedite to recover schedule lands in logistics. The customer's line-down claim lands in sales as a credit. The engineering time to investigate lands in a project code that nobody reconciles. The overtime to sort the suspect population lands in a supervisor's discretionary budget. Seven budgets, one defect, and no ledger that adds them up. Multiply by 40,000 defects a year and you have a number large enough to change the strategic direction of the company, distributed in slices small enough that no individual owner ever sees it.
This is why the reported figure is 4.9% and the real figure is 19.6%. The reported figure is what survives the accounting boundaries. The real figure is what the plant pays.
The distribution matters as much as the total. Across our sample, the fully loaded cost of poor quality breaks down roughly as follows: internal scrap and rework 26%, inspection and test labour 21%, containment and sorting 14%, warranty and field service 13%, expedites and premium freight 8%, recall and regulatory 7%, lost margin from capacity consumed by rework 6%, and management time 5%. Two observations follow. First, 41% of the cost is inspection and containment — the machinery of detection, not the cost of the defect itself. Second, the categories that hurt most strategically, warranty and recall, are only 20% of the total but carry all the variance: a single recall can be ten times the annual cost of every other category combined.
This asymmetry is the key to prioritisation. You do not reduce cost of poor quality by improving average quality. You reduce it by attacking the two structures that generate the tail: the inspection apparatus, which is 41% of the cost and exists only because the process is not trusted, and the containment scope, which converts a local defect into a company-level event.
3. Why the last forty years produced inspection instead of control
It is worth being fair to the industry. Inspection-heavy quality was not stupid. It was the rational response to the information environment of 1985, when a plant could measure output but not process, could count defects but not attribute them, and had no way to link a customer complaint to a specific tool state on a specific shift. In that environment, the only lever available was to check more. Statistical process control was a genuine advance because it moved the observation upstream, but SPC observes the distribution of a measured characteristic; it does not tell you which of forty interacting parameters moved.
The result is a quality discipline that is extremely sophisticated about measurement and remarkably primitive about attribution. A plant can tell you its Cpk on seventeen characteristics to three decimal places and cannot tell you why the defect rate doubled on the second shift in week 34. That gap — between measurement maturity and attribution maturity — is the space this paper occupies.
The gap widened rather than closed during the Industry 4.0 decade, for an ironic reason: instrumenting the plant produced more data without producing more attribution. A typical line now generates between 40,000 and 400,000 time-series points per hour. Almost none of it is organised around the unit being made. The data is organised around the machine, because the machine is what the historian was built for. So when a defect appears, the quality engineer has abundant data about what the machine was doing and no direct way to ask what happened to this specific part at this specific station at this specific second.
That is the unit-level gap, and it is the single most important missing capability in industrial quality. It is also, not coincidentally, the capability that makes containment scope computable. A plant that can answer "what happened to unit 4471" can answer "which units are affected." A plant that cannot, recalls everything.
4. The three numbers that define the problem
Before proposing an architecture, it is worth fixing the problem in three numbers, because quality debates tend to dissolve into anecdote without them.
The first number is the hidden multiplier: 4.0x. For every dollar of quality cost that appears in a plant's reported P&L, roughly four dollars are paid somewhere else in the organisation. This multiplier is remarkably stable across industries — 3.7x in automotive, 4.2x in medical devices, 3.9x in industrial machinery — and it is the reason quality programs that target the reported number systematically under-deliver. If you optimise scrap, you move cost into containment. If you optimise containment, you move it into warranty. The multiplier stays.
The second number is the inspection ceiling: 510 ppm. That is where an eight-gate value stream lands after seven successive doublings of control effort. It is not zero. It is not close to zero. It is half a defect per thousand units, which on a plant producing two million units a year is a thousand escapes annually, which is roughly the number that generates a mid-sized recall every eighteen months. The ceiling exists because inspection samples; the defect that escapes is by definition the one the sample missed.
The third number is the scope multiplier: 11.4x. For every unit actually affected by a defect, the average plant contains 11.4 units. The excess is not caution. It is the cost of not knowing. And because the excess is 91% of the containment, reducing the multiplier from 11.4 to 3.1 removes 73% of containment cost without changing the defect rate by a single part per million.
Those three numbers — 4.0x, 510 ppm, 11.4x — describe a system that is optimising the wrong variable. The rest of this paper is about what happens when you optimise the right one.
PART II — The Iceberg: What Finance Sees and What the Plant Pays
5. Anatomy of a cost that hides in eleven places
The iceberg metaphor is overused, but it is accurate here in a specific and useful way: the visible portion is not a random sample of the whole. It is systematically biased toward the categories that are easy to attribute to a single unit of production.
Scrap is visible because it has a part number and a quantity. Rework is visible because it has labour hours. Warranty is visible because it arrives as an invoice. Everything else is structural: inspection labour is a headcount line that would exist anyway, containment is absorbed into operations overtime, expedites are justified as schedule recovery, field service is a service contract, lost margin is counterfactual, and management time is simply not tracked. The visible 4.9% is the portion of the cost that happens to coincide with an accounting boundary.
The consequence is a systematic bias in investment decisions. A plant comparing a $2M vision system against a $2M process-control upgrade will evaluate the vision system against the visible scrap line it can reduce, and the process upgrade against a counterfactual it cannot prove. The vision system wins the business case and loses the economics, every time, for twenty years.
6. Industry variation: why medical devices pay 24.6% and food
解锁后续 88% 内容Unlock the Remaining 88% of Evaluations & the Decision Engine
The second half includes: a core solution cross-comparison matrix, a key parameter selection checklist, an implementation pitfalls guide, and a TCO & ROI calculator for mainstream approaches.
Get Your Custom Solution (View in Dashboard)