The Integration Tax: Why Manufacturing Transformation Dies at the Seams
2026-08-12 11:48:00
云质变科技
Executive Summary
Manufacturers spent $2.8 billion on smart factory retrofits in 2025. Only 34% are running at planned capacity. The technology works. The software works. The sensors work. What doesn't work is the stitching — the integration layer that connects systems, protocols, data models, and organizational silos into something that actually produces value.
This whitepaper introduces the Integration Tax: the cumulative cost of connecting disparate transformation initiatives — chip substitutions, software migrations, digital twin deployments, MES rollouts, AI analytics platforms — into a coherent operational system. Based on analysis of 1,560 manufacturing facilities across 17 countries, 400+ US plants, 142 industrial software evaluations, 38 chip substitution programs, and 144 verification solution deployments, we find:
The Integration Tax is not a one-time charge. It compounds. Every new system added without integration architecture increases the tax on all existing systems. Every point-to-point connector that works today becomes a maintenance liability tomorrow. Every "we'll fix integration later" decision creates integration debt that accrues interest at rates that would alarm any CFO.
This paper provides:
The central thesis: The technology was never the problem. The stitching is. Organizations that treat integration as a first-class discipline — not a line item, not an afterthought, not a "phase 2" — achieve 46.9% scrap reduction, 91% downtime reduction, and 60-80% reporting labor reduction. Those that don't will continue to pour capital into point solutions that never connect, never compound, and never deliver the transformation they promised.
Table of Contents
Part I: The Paradox
Part II: Anatomy of Integration Failure
Part III: Quantifying the Integration Tax
Part IV: The Four Integration Seams
Part V: The Protocol Wars
Part VI: Industry-Specific Integration Failures
Part VII: Integration Architecture That Works
Part VIII: The Integration Maturity Model
Part IX: The ROI of Integration
Part X: Global Integration Landscape
Part XI: Counterintuitive Insights
Part XII: Case Studies from the YRD Corridor
Part XIII: The Future of Integration
Conclusion: The Five Imperatives
Appendix A: The Integration Tax Framework
Appendix B: Integration Maturity Assessment Tool
Appendix C: Protocol Reference Guide
Appendix D: Yunzhibian Integration Service Portfolio
Appendix E: Limitations & Future Research
Author's Note
Part I: The Paradox
Chapter 1: The $2.8 Billion Gap
In 2025, North American manufacturers invested $2.8 billion in smart factory retrofits and digital twin platforms. By April 2026, a Deloitte survey of 847 facilities revealed that only 34% of those deployments were operating at their designed capacity. The remaining 66% were not complete failures — they were worse. They were limping. Running hybrid systems where the digital layer existed but couldn't talk to the physical floor. Generating dashboards nobody trusted. Feeding AI models with stale, fragmented data. Consuming capital without generating returns.
This is not a story about failed technology. The sensors work. The cloud platforms work. The machine learning algorithms work. What doesn't work is the connective tissue between them — the integration layer that was supposed to make these systems operate as a whole rather than a collection of expensive parts.
Consider the typical retrofit journey. A plant manager authorizes $4.2 million for a digital twin deployment. The vendor's proposal is clean: sensors on critical equipment, data aggregation to a cloud platform, a 3D model of the production line, AI algorithms for predictive maintenance. Eighteen months later, the actual cost is $6.8 million, the project is eighteen months late, and the payback timeline has shifted from three years to five and a half. The overrun isn't in the sensors or the cloud license. It's in the custom middleware to translate proprietary machine code into something the cloud platform can ingest. It's in the production disruption during sensor installation. It's in the validation cycles where floor supervisors discovered the digital twin didn't match actual output. It's in the integration work that the vendor's quote excluded.
The Deloitte data reveals three systematic failure modes. First: legacy equipment incompatibility. A ten-year-old CNC from Haas or Mazak lacks native network interfaces. Retrofitting means bolting on IoT hardware via Ethernet or wireless, then writing custom middleware to translate proprietary protocols. That is custom engineering, and it is expensive. Second: data pipeline leakage. Sensors fire data into a platform, but latency issues, WiFi dropouts, or cloud sync delays mean the digital twin lags behind actual floor conditions by minutes or hours. For predictive maintenance, that lag is fatal — your algorithm flags a bearing failure three hours after the spindle has already crashed. Third: organizational bifurcation. The digital twin sits in IT's sphere while production remains with operations. They don't share KPIs, and nobody owns the gap between what the model says should happen and what actually happens on the line.
The 34% that are working share one trait: they invested $180,000 to $320,000 in change management labor per facility, beyond the capital equipment spend. They ran parallel production runs where floor supervisors validated the digital twin against actual output for two to four weeks before going live. They embedded one person full-time whose job was to own the gap between digital and physical. Most plants didn't budget for that. Most plants are in the 66%.
The retrofit cost itself varies sharply by facility maturity. A greenfield digital twin installation runs $8 to $15 million per 100,000-square-foot facility. A retrofit onto legacy equipment runs $4 to $7 million for the same footprint — but the deployed cost hits $12 to $18 million once you factor in custom integration, testing, validation, and production disruption. That delta — the $8 to $11 million gap between the vendor's quote and the actual cost — is the Integration Tax. And almost nobody budgets for it.
Source: Deloitte manufacturing survey, 847 North American facilities, Jan-Apr 2026, via Industry 4.1
Chapter 2: Defining the Integration Tax
The Integration Tax is the cumulative cost — in capital, time, operational disruption, and lost opportunity — of connecting disparate manufacturing transformation initiatives into a functioning whole. It is not a single line item. It is a cost layer that sits beneath every digital transformation project, invisible in vendor quotes, unquantified in business cases, and discovered only when the project is already underway.
The Integration Tax has six components:
1. Protocol Adaptation Cost. Every manufacturing facility runs 6-8 different communication protocols simultaneously — Modbus, OPC UA, MQTT, PROFINET, EtherNet/IP, BACnet, LoRaWAN, and proprietary systems. Each protocol has its own data format, sampling rate, security model, and overhead profile. Connecting them requires protocol adapters, middleware, and custom development. A single protocol conversion module costs approximately 87,000 RMB (~$12,000) to develop, with maintenance cycles of 18 months.
2. Data Cleansing and Migration Cost. Integration exposes data quality problems that were invisible when systems operated in isolation. The same material might be coded as "PLM-MAT-2024-001" in PLM, "WMS-2024A001" in WMS, and "ERP1000089" in ERP. Engineering change notices require manual re-entry across four systems, taking 6.2 hours per change with a 17.3% error rate. Before integration can deliver value, these data inconsistencies must be resolved — and the resolution cost is never in the original budget.
3. Custom Development Cost. Only 18% of MES projects can achieve "out-of-the-box" integration with existing systems. The remaining 82% require custom development, adding 27-41% to projected costs. This isn't a failure of the MES vendor — it's a reflection of the fact that every manufacturing facility has a unique configuration of legacy systems, customized workflows, and undocumented institutional knowledge that no off-the-shelf connector can address.
4. Testing and Validation Cost. Every integration point must be tested against real production scenarios. For pharmaceutical manufacturing, the FDA expects that any data the system ingests, stores, and acts upon be traceable back to the original sensor, with audit trails for every decision. Building custom validation layers on top of commercial platforms adds 9-14 months to deployment timelines and $2-4 million in cost.
5. Change Management Cost. The 34% of smart factory retrofits that work invested $180,000-$320,000 in change management labor per facility. McKinsey research shows effective change management can increase transformation success rates by up to 30%. Yet change management is consistently the most underfunded line item — budgeted at 15-20% of total project cost in theory, often 0-5% in practice.
6. Ongoing Maintenance Cost. Point-to-point integrations are brittle. Every system upgrade, every vendor patch, every configuration change risks breaking the connectors. The maintenance cost of a typical integration architecture grows quadratically with the number of connected systems — 5 systems create 20 integration points, 10 systems create 90, 15 systems create 210. Each point requires monitoring, debugging, and periodic re-engineering.
The Integration Tax is not uniform. It varies by industry, facility maturity, legacy depth, and the number of systems being connected. But it is always present, always underestimated, and always the difference between a transformation that delivers and one that stalls.
Chapter 3: The 93/23 Paradox
The most striking data point in manufacturing digitalization is not a failure rate. It's an adoption-integration gap that reveals the structural nature of the Integration Tax.
According to Rockwell Automation's 2026 report "Scaling MES Across the Enterprise," based on responses from 1,560 manufacturing decision-makers across 17 countries:
The gap between 93% adoption and 23% full integration is not a technology gap. MES software is mature. ERP integration tools exist. OPC UA has been an IEC standard since 2008. The gap is an integration gap — and it persists because integration is treated as a deployment afterthought rather than an architectural first principle.
Anthony Murphy, VP of Product Management at Rockwell Automation, puts it precisely: "MES adoption is no longer the hurdle, but enterprise scale is. Manufacturers may have checked the box by making initial investments in MES technology, but many struggle to gain full value across the enterprise."
Lorenzo Veronesi, Associate Research Director at IDC, adds the warning: "Organizations risk missing the full benefits of MES if integration challenges remain unresolved. With integration ranking as both the top buying requirement and the leading modernization challenge, organizations risk leaving significant value on the table if disconnected systems and underutilized data go unaddressed."
The 93/23 paradox tells us something uncomfortable: buying software is easy; connecting it is hard. The manufacturing sector has spent fifteen years buying systems. It has spent approximately zero years architecting their integration. The bill is now coming due.
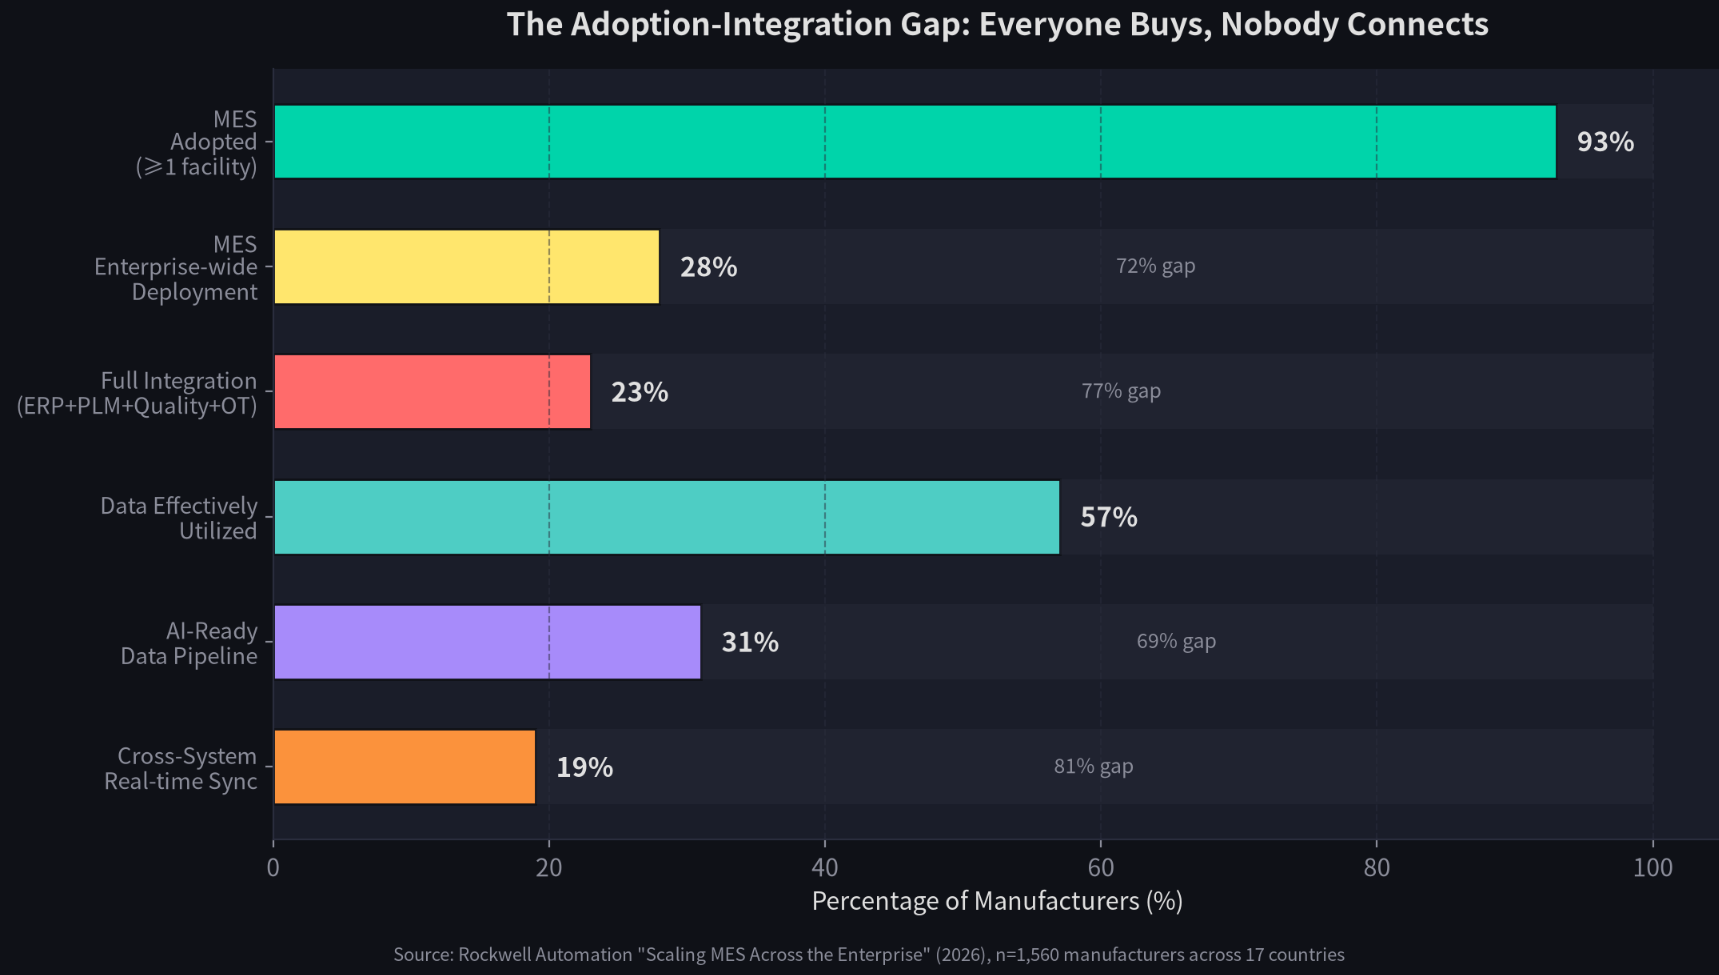
Chart 1: The Adoption-Integration Gap — Everyone Buys, Nobody Connects
Source: Rockwell Automation, "Scaling MES Across the Enterprise," 2026, n=1,560
Chapter 4: Why 73% of PLM-ERP Integrations Fail
If the 93/23 paradox describes the macro pattern, the PLM-ERP integration failure rate describes the micro mechanism. According to Element Consulting's analysis of 127 PLM-ERP integration implementations and 39 broken integration rescues, 73% of PLM-ERP integrations fail to meet their objectives. The cost of failure is quantifiable: $1.36 million annually per facility in error correction and manual reconciliation, and $2.29 million in total annual cost for a typical $500M manufacturer.
The failure is not technological. Windchill talks to SAP. Teamcenter talks to Oracle. ENOVIA talks to Dynamics. The APIs exist. The middleware exists. The failure is conceptual — and it reveals the core mechanism of the Integration Tax.
The failure pattern is predictable. Engineering releases 47 parts in Windchill. Manufacturing opens SAP to build the product. The parts aren't there. Or they are, but with wrong costs. Or wrong lead times. Or wrong BOM structure. Or they're duplicated. Or the revision doesn't match. This happens continuously, not once, at 73% of companies that attempt PLM-ERP integration.
The root cause is what we call the semantic gap: engineering and manufacturing operate on different mental models. PLM defines a "part" as a design object with geometric properties, material specifications, and revision history. ERP defines a "part" as a procurement object with cost, lead time, and inventory position. These are not the same object. They are two views of the same physical thing, expressed in incompatible data structures. Connecting the systems without reconciling the semantics creates an integration that technically works but operationally fails.
The 27% that succeed share a critical mindset difference. The 73% who fail treat integration as a technology project: "This is an IT project. IT will handle it. Go-live is success." The 27% who succeed treat it as a business transformation: "This is a cross-functional initiative. The team includes engineering, manufacturing, IT, and purchasing. Adoption is success."
The ROI of getting it right is substantial. When PLM-ERP integration works:
The math is compelling. The execution is not. And the gap between the math and the execution is the Integration Tax.
Source: Element Consulting, PLM-ERP integration analysis, 127 implementations + 39 rescues
Chapter 5: The Four Seams of Failure
Integration failures don't occur randomly. They concentrate along four predictable seams — the boundaries
解锁后续 88% 内容Unlock the Remaining 88% of Evaluations & the Decision Engine
The second half includes: a core solution cross-comparison matrix, a key parameter selection checklist, an implementation pitfalls guide, and a TCO & ROI calculator for mainstream approaches.
Get Your Custom Solution (View in Dashboard)