How Decoupling Made the World More Dependent on Chinese Manufacturing
2026-08-22 14:46:00
云质变科技
Executive Summary
The world has spent roughly $4 trillion trying to reduce its dependence on Chinese manufacturing. That is the estimated cumulative cost of supply chain disruptions, reshoring incentives, tariff programs, and "China+1" diversification strategies deployed by multinational corporations and Western governments since 2018. The result? Direct imports from China to the United States fell by nearly one-third in 2025. But total US manufactured goods imports rose 4.6% to $2.98 trillion. The trade deficit widened. Consumer prices increased. And the structural dependency on Chinese intermediate inputs—components, materials, sub-assemblies, machinery, and tooling—did not decrease. It deepened.
This is the resilience trap: the more aggressively the world pursues decoupling, the more it discovers that true supply chain independence cannot be achieved by relocating final assembly. It requires replicating an entire industrial ecosystem—the supplier networks, the skilled workforce, the logistics infrastructure, the digital backbone, and the institutional knowledge—that took China four decades to build. No alternative location has come close. Vietnam, India, Mexico, and Thailand have collectively absorbed billions in foreign direct investment, but they remain transit hubs for Chinese intermediate goods, not independent manufacturing bases. The final label changes. The supply chain does not.
Meanwhile, China did not stand still. While the West debated reshoring, China upgraded. Between 2020 and 2026, the high-tech manufacturing share of industrial value-added rose from 15.1% to 18.2%. Equipment manufacturing's share climbed from 33.7% to 38.0%. Digital transformation coverage among industrial firms reached 89.6%, and AI application in manufacturing hit 30%—on track to exceed 38% by year-end 2026. In the first quarter of 2026, integrated circuit manufacturing output surged 49.4% year-over-year. China is no longer just the world's assembler. It is becoming the world's most advanced manufacturing platform—digitally networked, AI-enabled, and moving upvalue faster than any economy in history.
This white paper presents six uncomfortable findings:
These findings lead to a conclusion that many readers will find uncomfortable: the path to supply chain resilience does not run through decoupling. It runs through deeper digital integration, smarter supplier development, and a clear-eyed recognition that the Chinese manufacturing ecosystem is not easily replicated—and that attempting to do so without understanding why is the most expensive strategic mistake a manufacturing executive or policy maker can make.
This white paper is not a brief for or against any country's trade policy. It is a practitioner's assessment, grounded in data, of what actually works in global manufacturing today. We have worked with manufacturing enterprises across the Yangtze River Delta—the densest, most digitally advanced industrial cluster on Earth—and we have seen firsthand why the ecosystem matters, why relocation is harder than PowerPoint suggests, and where the genuine opportunities lie for companies that choose engagement over withdrawal.
The resilience trap is real. But it is not inescapable. The exit requires understanding what you are actually trying to build, measuring what resilience truly costs, and investing in the digital capabilities that make any supply chain—wherever it is located—more adaptive, transparent, and robust.
Table of Contents
Part I: The Paradox
Part II: The Evidence
7. The Reshoring Data
8. The Import Shift
9. The Hidden Dependency
10. The Tariff Cascade
11. The Cost Premium
12. The Capacity Gap
13. The Skilled Labor Shortage
14. The Infrastructure Deficit
Part III: The Counter-Move — China's Upgrade
15. From Factory Floor to Value Chain
16. The Intelligent Factory Network
17. The Digital Infrastructure Stack
18. The AI Manufacturing Leap
19. The New Export Mix
20. The Supplier Ecosystem
21. The Green Manufacturing Advantage
22. The R&D Acceleration
Part IV: The Regional Players
23. Vietnam — The Transit Hub
24. India — The Unfinished Factory
25. Mexico — The Nearshore Mirage
26. Southeast Asia — The Second Tier
27. Europe — The Regulatory Trap
28. The United States — The Expensive Return
29. The China+1 Fallacy
30. What "Friendshoring" Actually Buys
Part V: The Resilience Architecture
31. What True Resilience Looks Like
32. The Five Pillars
33. Digital Supply Chain Twins
34. Multi-Tier Visibility
35. The Autonomous Supply Chain
36. Regionalization Without Decoupling
37. The Supplier Development Imperative
38. Measuring Resilience
Part VI: The China Advantage — A Practitioner's View
39. Why the Ecosystem Matters
40. The Speed Advantage
41. The Scale Advantage
42. The Digital Maturity Advantage
43. The Cost-Quality Frontier
44. The Yangtze River Delta Model
Part VII: Scenarios and Strategy
45. Three Scenarios for 2030
46. The "Fortress" Scenario
47. The "Hybrid" Scenario
48. The "Digital Resilience" Scenario
49. What Multinationals Should Do
50. What Western Governments Should Do
51. What Chinese Manufacturers Should Do
52. The 24-Month Playbook
Part VIII: Case Studies
53. Case 1 — Electronics EMS in Suzhou
54. Case 2 — Automotive Components in Wuxi
55. Case 3 — Chemical Processing in Changzhou
56. Case 4 — Semiconductor Equipment in Shanghai
Part IX: The Counter-Arguments
57. "But China's Labor Costs Are Rising"
58. "But Geopolitics Will Force Decoupling"
59. "But India/Vietnam Will Catch Up"
60. "But Technology Will Level the Playing Field"
61. "But Tariffs Will Eventually Work"
62. The Hard Truth
Part X: Conclusion
63. The Resilience Dividend
64. The New Competitive Map
65. What This Means for You
66. Final Word
Appendices
Part I: The Paradox
1. The $4 Trillion Misdiagnosis
In the five years between 2020 and 2025, supply chain disruptions cost the global economy an estimated $4 trillion, according to McKinsey & Company. This is not a rounding error. It is larger than the entire GDP of Germany. It represents factory shutdowns, port closures, delayed product launches, lost contracts, emergency air freight premiums, and the cascading waste of a system optimized for cost efficiency and utterly unprepared for systemic shock.
The diagnosis that emerged from this pain was simple and emotionally satisfying: global supply chains had become too dependent on China. The cure, equally simple: diversify. Reshore. Nearshore. Friendshore. Build "China+1" strategies. Bring critical manufacturing home. The political class embraced it. The consulting industry amplified it. Boardrooms funded it. Governments legislated it. The US CHIPS and Science Act alone catalyzed over $200 billion in private semiconductor investment. The Reshoring Initiative reported that 60% of new manufacturing facility investments in 2025 were reshoring or nearshoring projects. Kearney's 2026 Reshoring Index documented the most significant country-of-origin shifts in a decade.
But here is the uncomfortable reality that the data now reveals: the diagnosis was incomplete, and the cure is not working as advertised.
Total US manufactured goods imports increased from $2.85 trillion in 2024 to $2.98 trillion in 2025—a 4.6% increase—while US domestic manufacturing output remained essentially flat. Direct imports from mainland China fell by nearly one-third, a shift of -$135 billion. But the other 13 Asian low-cost countries and regions gained $194 billion in US imports—more, in absolute terms, than China lost. Mexico gained $47 billion. Europe gained $62 billion. The imports did not come home. They changed their postal address.
The US trade deficit in goods reached $1.24 trillion in 2025, up 2.1% year-over-year. In May 2026 alone, the monthly deficit hit $106.5 billion. The Peterson Institute for International Economics estimates that the 2025–2026 US tariff regime costs the average American household between $2,800 and $3,800 per year in higher prices. The Boston Federal Reserve found that tariff increases and labor productivity gains together contributed only 0.5 percentage point to core PCE inflation in 2025—suggesting that tariffs are a significant but not dominant inflation driver, yet one that delivers no measurable industrial policy return.
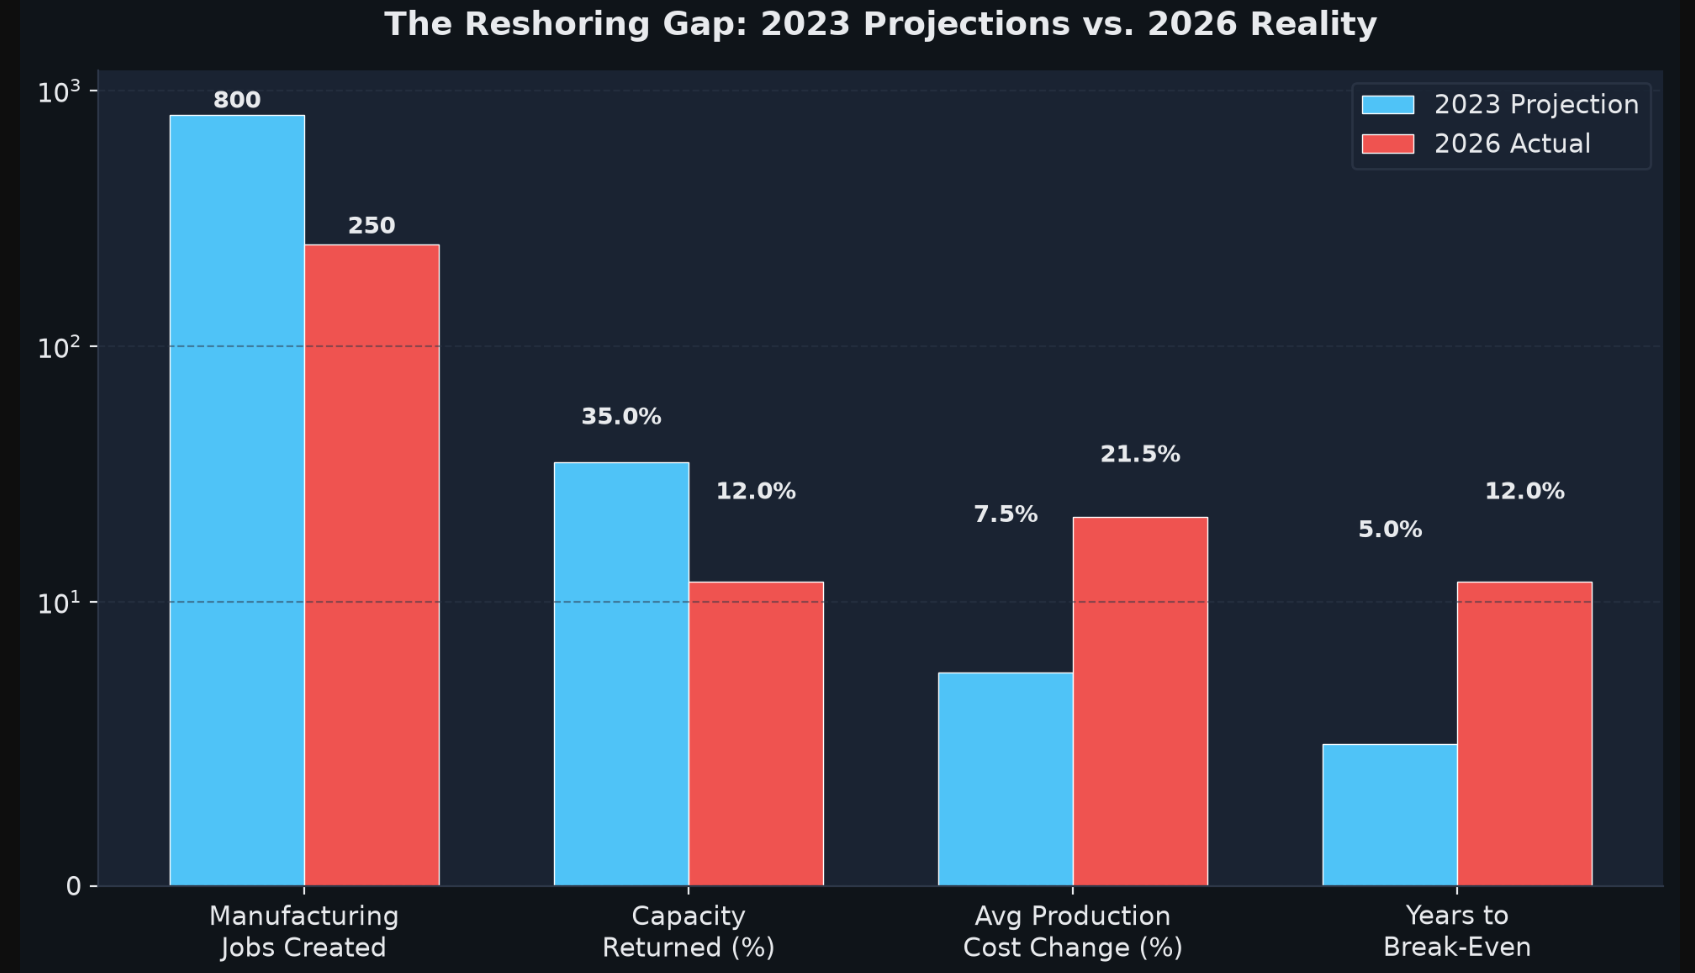
GlobalInsightWire's June 2026 analysis of reshoring outcomes is blunt: only 10–15% of previously offshored manufacturing capacity demonstrably returned to Western economies by 2026. The 800,000 jobs projected in 2023 became 250,000 actual positions. Average production cost increases hit 18–25%, not the 5–10% initially projected. Government incentives, while substantial, were undermined by bureaucratic hurdles, skilled labor shortages, and the sheer capital intensity of advanced manufacturing.
The $4 trillion was spent. The dependency did not break.
This is not an argument that supply chain resilience is unnecessary. It is an argument that the dominant approach to achieving it has been based on a category error: treating geographic relocation as equivalent to resilience building. They are not the same thing. A supply chain that moves final assembly from Shenzhen to Bac Ninh but still sources 42% of its components from China is not more resilient. It is more complex, more expensive, and potentially more fragile—because it now has two borders to cross instead of one.
2. What "Resilience" Actually Means
The word "resilience" has been so thoroughly politicized and commodified that it has lost operational meaning. For politicians, it means bringing jobs home. For consultants, it means billable hours from supply chain redesign projects. For executives, it means whatever protects the next quarterly earnings call from a supply disruption headline.
Let us define it precisely. Supply chain resilience is the capacity of a production and distribution network to absorb, adapt to, and recover from disruptions while maintaining continuous operations. It has five measurable dimensions:
Geographic relocation addresses only one element of redundancy (alternative production location) while potentially degrading visibility (longer, more complex supply chains), flexibility (new, less experienced suppliers), velocity (more border crossings, longer lead times), and robustness (immature supplier ecosystems with thinner talent pools). It is not that diversification has no value—it does. But it is a necessary condition, not a sufficient one. And when pursued as a substitute for the harder work of building digital visibility, supplier capability, and organizational agility, it becomes actively counterproductive.
The companies that emerged strongest from the disruptions of 2020–2025 did not necessarily relocate. They invested in the digital infrastructure of resilience. Schneider Electric, ranked #1 on the Gartner Supply Chain Top 25 for four consecutive years, built its leadership on "end-to-end resource orchestration"—using generative and agentic AI to coordinate decisions across its global footprint, not by withdrawing from it. NVIDIA, ranked #2, compressed GPU lead times from 20 weeks to under 12 weeks through multi-source wafer commitments, advanced packaging pre-allocations, and regional distribution—not by bringing all production to the United States, but by intelligently distributing it across Taiwan, South Korea, and the US in what it calls "ally-shoring."
Gartner's 2026 analysis identifies three macro trends among supply chain leaders: (1) the autonomous workforce, where AI agents manage routine decisions and humans focus on governance and strategy; (2) network-centric strategies, where supply chain design is treated as continuous agile adjustment rather than a one-time location decision; and (3) end-to-end supply orchestration, extending visibility and planning beyond enterprise boundaries to multi-tier suppliers. Not one of these trends is primarily about geography. They are about intelligence, connectivity, and adaptability.
The Proxima 2026 Global Supply Chain Resilience Outlook found that nearly half of global enterprises could not maintain operations for more than three weeks during a major supply chain disruption. In Singapore, the most resilient market surveyed, 23% of companies could sustain operations for 4–6 months. The gap between Singaporean and German companies (9.9% could sustain 4–6 months) is not explained by geography—it is explained by digital readiness. Singaporean firms lead in AI adoption for supply chain risk management, with 93% having tested response plans and 47% reporting full preparedness.
Resilience, in short, is a digital capability, not a postal address.
3. The Reshoring Scorecard: 10–15%
Let us examine the reshoring record with the rigor it deserves. According to Kearney's 2026 Reshoring Index, the data tells a nuanced story that neither the reshoring cheerleaders nor the globalization absolutists will find fully satisfying.
The US manufacturing import ratio (MIR)—total manufactured goods imports from 14 Asian low-cost countries as a percentage of US domestic manufacturing output—has continued to rise. In aggregate, the 2026 Reshoring Index is negative, meaning imports grew faster than domestic production. This is the fourth consecutive year of negative readings, despite the highest levels of reshoring-related investment in history.
But Kearney also identifies genuine category-specific progress. Computer and electronic products, and apparel and accessories—the two largest Asian LCCR import categories—continue to outpace domestic production growth, deepening import dependency. However, a majority of other product categories show small but measurable reshoring trends. The question, as Kearney notes, is whether these category-specific upticks will persist, since similar positive movements in 2022–2023 reversed the following year.
Approximately $300 billion in US imports changed country of origin between 2024 and 2025, while US domestic manufacturing output stayed flat. This is the central paradox of the current era: massive capital flows into domestic manufacturing (annual investment numbers are double or triple pre-COVID levels, per Kearney) have produced only modest capacity increases. The announced investments—semiconductor fabs in Arizona, battery plants in Georgia, EV facilities across the Southeast—are real, but they are slow to come online, capital-intensive, and constrained by workforce shortages.
The IMF's Q1 2026 World Economic Outlook reported that global manufacturing output growth slowed to 1.8% in 2025, down from 3.5% in 2022. A significant portion of this deceleration was attributed to tightened monetary conditions in advanced economies, which raised the cost of capital for the very reshoring projects that governments were trying to incentivize. When interest rates doubled, the ROI math on new domestic factories changed overnight. Projects that looked viable at 3% cost of capital became marginal at 6%.
The result is what we might call the reshoring gap: the difference between political intent and economic reality.
表格
Factor
2023 Projection
2026 Actual
Gap
Manufacturing jobs created
~800,000
~250,000
-69%
Capacity returned
~35%
10–15%
-57%
Avg. production cost increase
5–10%
18–25%
+13–15 pp
Break-even timeline
~5 years
~12 years
+7 years
Primary drivers
Resilience, national security
Geopolitical tension, limited skilled labor
Shifted
The gap is not a failure of policy alone. It reflects a fundamental misunderstanding of what manufacturing competitiveness requires. It is not enough to build a factory. You need a workforce that can operate it, a supplier base that can feed it, an energy infrastructure that can power it affordably, a logistics network that can move its output, and a regulatory environment that does not strangle it. Each of these elements is independently difficult to build. Together, they constitute an ecosystem—and ecosystems cannot be legislated into existence.
4. The Diversification Illusion
If reshoring has underdelivered, what about "China+1"? Has the world at least succeeded in diversifying its sourcing away from China?
The answer depends on whether you measure diversification by country of origin on customs forms or by value-added origin in the supply chain.
By the first measure, yes. Direct Chinese imports to the US fell substantially in 2025. Vietnam's manufacturing FDI hit a record $28 billion in 2025, up 12% year-over-year. India's production-linked incentive schemes attracted billions in electronics manufacturing. Mexico's US imports grew 8% in 2025, driven by a $47 billion increase in computer and electronics products.
But by the second measure—where the value is actually created—the picture is dramatically different.
SupplyChainBrain's July 2026 analysis, "Why 'China Plus One' Alone Doesn't Reduce Supply Chain Risk," documents how many companies "took the path of least resistance, creating the illusion of diversification without
解锁后续 88% 内容Unlock the Remaining 88% of Evaluations & the Decision Engine
The second half includes: a core solution cross-comparison matrix, a key parameter selection checklist, an implementation pitfalls guide, and a TCO & ROI calculator for mainstream approaches.
Get Your Custom Solution (View in Dashboard)