The Trust Tax: How Verification Became the Hidden Bottleneck of Global Manufacturing Transformation
2026-08-09 17:17:00
云质变科技
Executive Summary
Every supply chain transformation—whether swapping a microcontroller, migrating from Siemens to a domestic MES, or replacing an entire EDA toolchain—faces an invisible tax that nobody budgets for. We call it the Trust Tax: the cumulative cost of proving that a substitution works before, during, and after deployment. Based on analysis of 142 industrial software evaluations, 38 chip substitution models, and 144 verification plans conducted by Yunzhibian across the Yangtze River Delta manufacturing corridor, this whitepaper exposes a structural gap that the $260 billion testing, inspection, and certification (TIC) industry has failed to close.
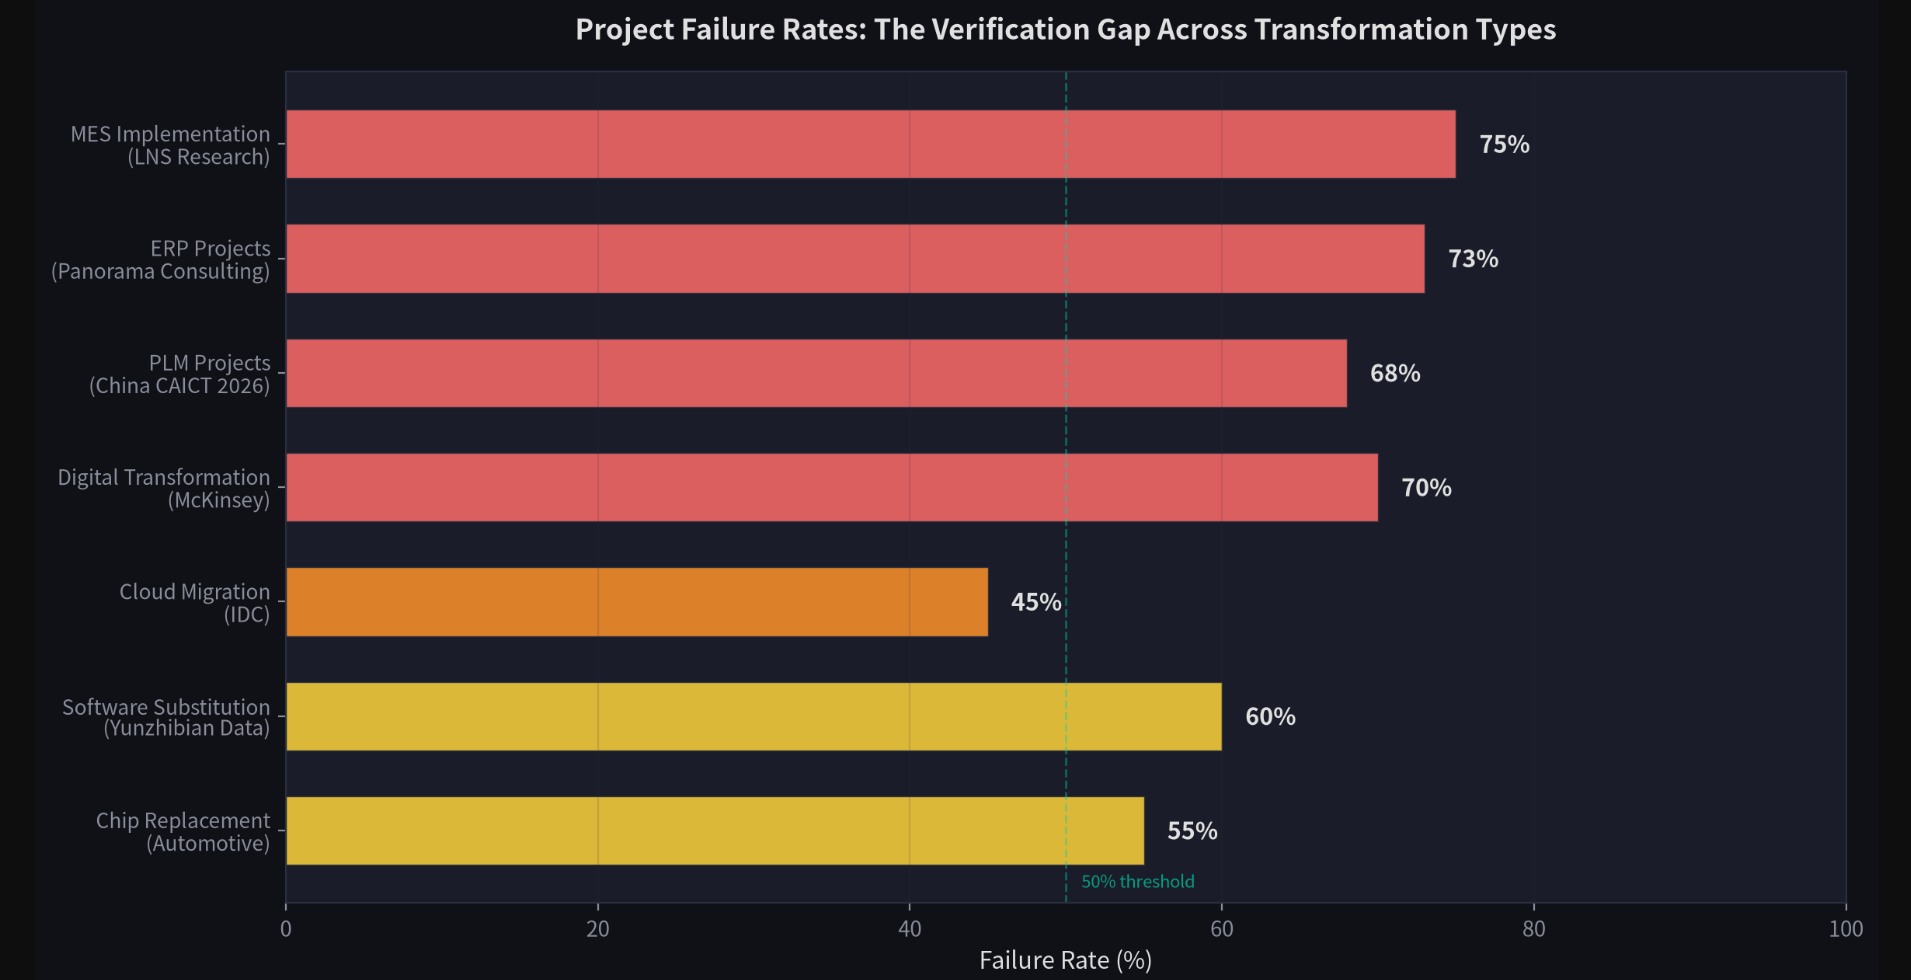
The numbers are stark. Seventy-five percent of MES implementations fail completely—not underperform, fail. PLM projects succeed only 32% of the time. Sixty percent of chip substitution projects generate hidden technical debt from incomplete verification. The Trust Tax adds 61% to the base cost of every substitution project, yet it appears nowhere in standard ROI calculations. By 2030, as the global substitution market scales to $550 billion, verification costs will consume an estimated $160 billion—a figure larger than the entire GDP of New Zealand.
This whitepaper argues three things. First, verification is not a compliance afterthought; it is the primary bottleneck of every transformation initiative. Second, the current TIC industry—fragmented across 54,000 institutions in China alone—cannot scale to meet the verification demands created by simultaneous supply chain bifurcation, software sovereignty campaigns, and digital transformation mandates. Third, the solution is not more testing but fundamentally different verification architectures: front-loaded, AI-augmented, and built on digital twin infrastructure.
For executives navigating supply chain transformation, the central insight is uncomfortable: the question is no longer "Can we substitute?" but "Can we verify the substitution fast enough to matter?" In a world where component lead times stretch to 55 weeks and AEC-Q100 re-qualification consumes 16 weeks, the verification timeline—not the substitution decision—determines competitive survival.
Part I: The Problem
Chapter 1: The $460 Billion Paradox
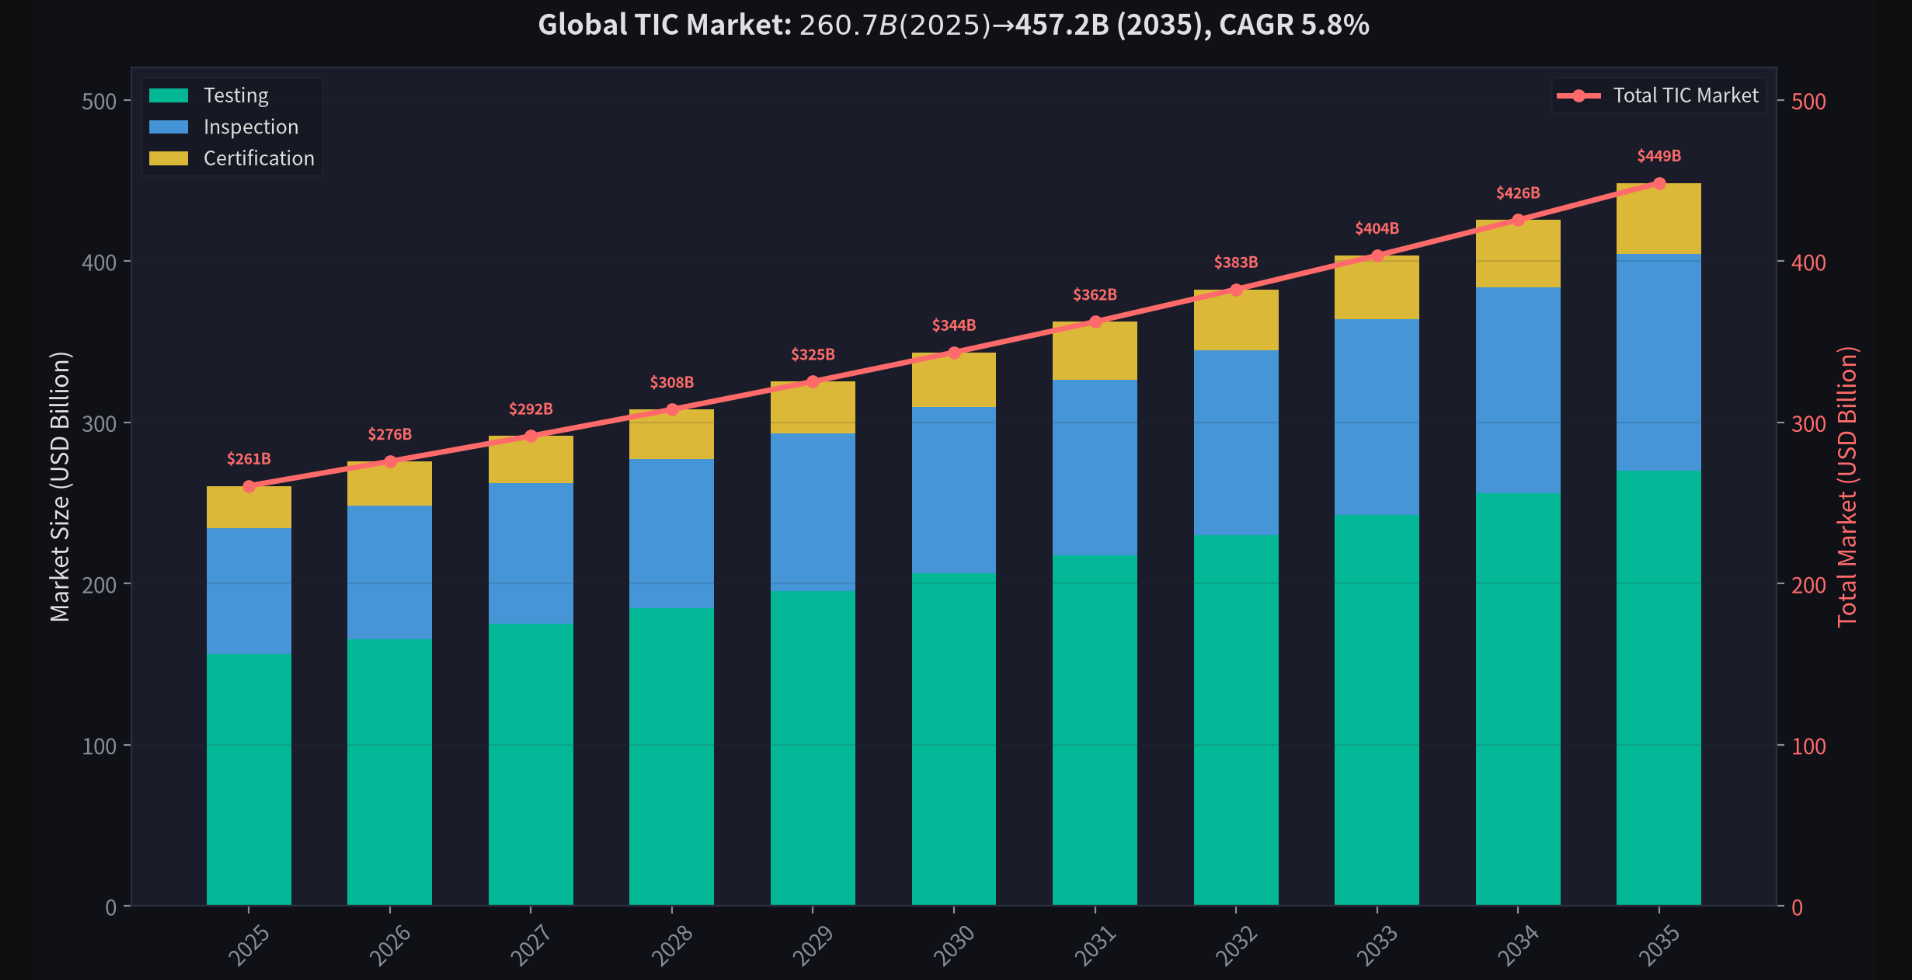
The global Testing, Inspection, and Certification (TIC) market reached $260.7 billion in 2025 and is projected to grow to $457.2 billion by 2035 at a compound annual rate of 5.8%. By any measure, this is a massive industry—larger than the global semiconductor equipment market and roughly half the size of the entire global semiconductor industry. Testing services alone account for 60% of TIC revenue, with inspection contributing 30% and certification 10%.
Yet here is the paradox: despite this enormous expenditure, manufacturing transformation projects fail at rates that would be unacceptable in any other domain. Seventy-three percent of ERP implementations fail to meet objectives, with an average cost overrun of 215%. Seventy-five percent of MES initiatives fail completely. Only 32% of PLM projects achieve their intended business value. These are not marginal underperformances; they are systemic failures that waste billions annually.
The disconnect is simple but devastating. The TIC industry was built for a world where products were tested after they were built, components were qualified once and used for a decade, and software systems were upgraded on a predictable five-year cycle. That world no longer exists. In today's environment, substitution is constant—driven by geopolitical supply chain fragmentation, technology decoupling, and the relentless pressure to replace foreign components with domestic alternatives. Each substitution triggers a verification requirement, but the verification infrastructure was never designed for this volume or this velocity.
Consider the mathematics. A typical mid-sized electronics manufacturer maintains a bill of materials (BOM) with 500-2,000 active component line items. If geopolitical pressure or supply disruption forces substitution of just 20% of those items per year—200-400 components—and each requires an average of 8 weeks for full re-qualification, the aggregate verification burden is 1,600-3,200 component-weeks annually. At an average verification cost of $3,000-$8,000 per component (including testing, documentation, and certification), the annual Trust Tax ranges from $600,000 to $3.2 million for a single mid-sized manufacturer. Multiply this across the hundreds of thousands of manufacturers globally undertaking substitution programs, and the $260 billion TIC market suddenly looks undersized.
The paradox, then, is that we are spending $260 billion on testing and certification, yet transformation projects fail 70% of the time. The money is being spent, but it is being spent on the wrong things, at the wrong time, in the wrong way.
Chapter 2: The 75% Failure Rate Nobody Talks About
When LNS Research reported that 75% of manufacturing operations software initiatives fail, the industry treated it as a cautionary statistic. It is, in fact, a structural indictment. These projects do not fail because the software is defective. The technology almost always works as designed. They fail because of what sits beneath the software layer—five technical root causes that are collectively a verification problem masquerading as an implementation problem.
Root Cause 1: Dirty Master Data. BOMs, routings, and capacity models are incomplete or outdated. The system is asked to operate on data that does not match physical reality. This is, fundamentally, a verification failure: nobody verified that the digital model corresponded to the physical factory before commissioning the software.
Root Cause 2: Non-Feasible Work Orders. Planning systems generate orders that the shop floor cannot execute because constraints are incorrectly modeled. Again, a verification gap: the constraint model was never validated against actual shop floor capabilities.
Root Cause 3: Materials Disconnected from Plan. Material availability and lead times are not aligned with the production schedule. The integration between procurement data and planning systems was never verified end-to-end.
Root Cause 4: Fragile Integration. Point-to-point scripts and manual handoffs make connections between systems brittle. Each integration point represents an unverified assumption about data consistency, timing, and error handling.
Root Cause 5: Undocumented Institutional Knowledge. Critical know-how lives in the heads of veteran engineers and in spreadsheets, not in the system. This is the most insidious verification gap: the system was never verified against the actual operational knowledge that makes the factory run.
The China Academy of Information and Communications Technology (CAICT) reported in its 2026 Industrial Software Industry Development White Paper that 41% of PLM projects experience delays, 27% exceed budget, and 15% are ultimately terminated or abandoned. The success rate stands at a mere 32%. Yet 60% of companies do not systematically review their own pain points before beginning PLM selection. They are, in effect, attempting to verify a solution against a problem they have not defined.
The Smartermrp analysis frames this precisely: "The failures are not random. They concentrate in five technical root causes that sit below the software layer." Every one of those five causes is a verification failure. The industry calls it "implementation risk." We call it what it is: the Trust Tax.
Chapter 3: The Trust Tax Defined
The Trust Tax is the total cost of verifying that a substitution—of a component, a software system, or an entire manufacturing architecture—performs equivalently to or better than the original, across all relevant dimensions, over the expected lifecycle, under all operating conditions.
It is not a single line item. It is a cost stack that accumulates across seven layers:
Layer 1: Component Testing. Electrical parameter verification, thermal characterization, and reliability testing for each substituted component. Cost: $2,000-$15,000 per component depending on complexity and certification requirements.
Layer 2: System Integration Validation. Verifying that the substituted component works within the larger system—PCB signal integrity, firmware compatibility, communication protocol conformance. Cost: $5,000-$50,000 per integration point.
Layer 3: Regression Testing. Re-running the full test suite to ensure the substitution has not introduced new failures elsewhere in the system. Cost: $3,000-$20,000 per regression cycle.
Layer 4: Field Trial and PPAP. Production Part Approval Process (PPAP) for automotive, or equivalent field validation for industrial applications. Cost: $10,000-$100,000 per part, with timelines of 8-16 weeks.
Layer 5: Documentation and Certification. Generating compliance documentation, obtaining certifications (AEC-Q100, UL, CE, IATF 16949), and maintaining audit trails. Cost: $5,000-$30,000 per certification.
Layer 6: Rework from Failed Verification. When verification uncovers incompatibilities, the cost of redesign, re-testing, and schedule disruption. Based on Yunzhibian's dataset of 142 software evaluations and 38 chip substitution models, 60% of substitution projects require at least one round of rework, adding an average of 18% to the base budget.
Layer 7: Opportunity Cost. The revenue lost during the extended verification timeline. A 16-week AEC-Q100 re-qualification cycle means 16 weeks of delayed production, delayed revenue, and delayed market entry. This is rarely quantified but consistently the largest hidden cost.
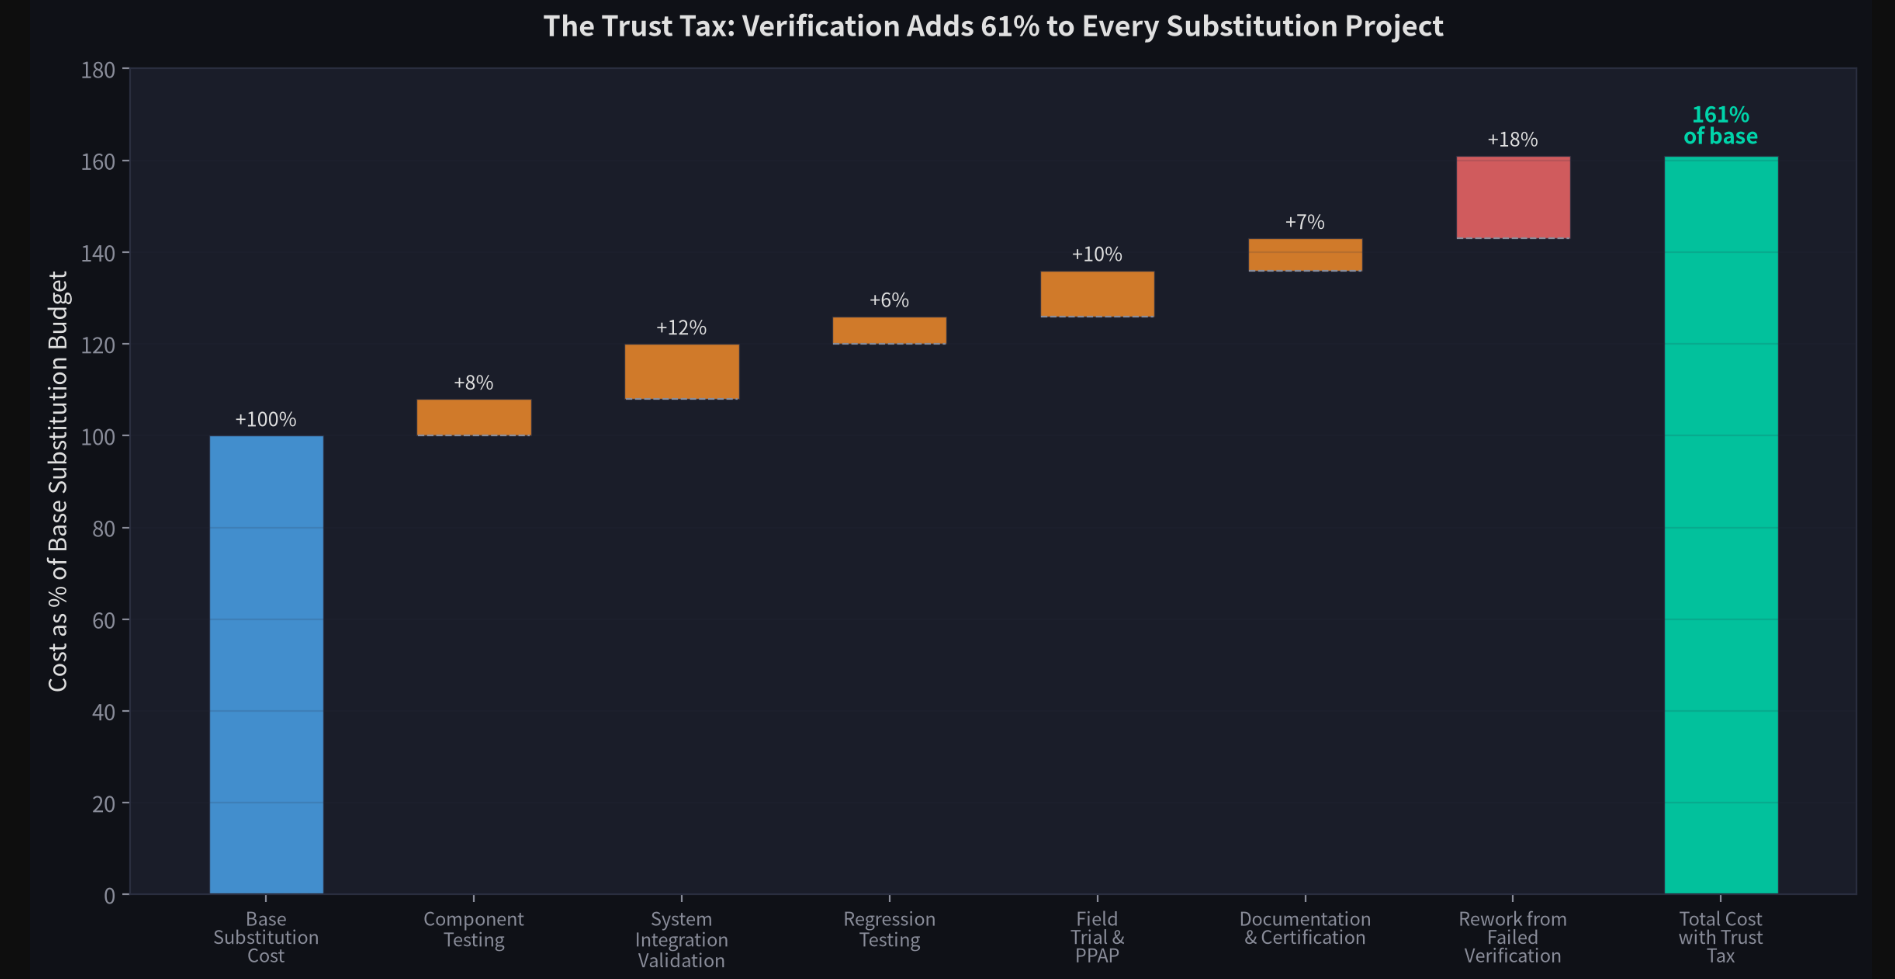
When these seven layers are summed, the Trust Tax adds approximately 61% to the base substitution cost. For a $100,000 component substitution program, the real cost is $161,000. For a $10 million MES migration, expect to spend $16.1 million. This figure is consistent across industries and substitution types, varying primarily in the distribution of costs across layers rather than the total magnitude.
Chapter 4: Why Verification Became the Bottleneck
To understand why verification, rather than substitution itself, became the bottleneck, consider the structural changes that have occurred in global manufacturing over the past five years.
Change 1: Velocity of Substitution. The geopolitical environment has compressed substitution timelines from years to months. When the U.S. Entity List expanded in December 2024 to include Chinese EDA companies, affected firms had weeks, not years, to identify and validate alternatives. When Siemens EDA cut off Chinese customers in May 2025, the verification clock started immediately—but the verification infrastructure was built for planned, orderly transitions, not emergency substitutions.
Change 2: Complexity of Equivalence. Modern components and software systems are not independently verifiable. A microcontroller substitution requires verifying not just the MCU itself but its firmware compatibility, its communication protocol behavior, its electromagnetic emissions, its thermal performance under specific load profiles, and its interaction with every other component on the board. The verification surface area grows exponentially with system complexity.
Change 3: Fragmentation of Standards. As supply chains bifurcate, standards fragment. A component qualified under AEC-Q100 in the United States may need re-qualification under China's GB/T standards for domestic automotive applications. A software system certified under IEC 62443 for cybersecurity may need separate verification under China's cybersecurity law. Each standards regime creates its own verification overhead.
Change 4: Loss of Institutional Knowledge. The engineers who built the original systems are retiring. In a custom MES, undocumented dependencies include PLC bindings, proprietary database schemas, hardware timing requirements, and legacy protocol bridges—none visible in documentation, all surfacing during transformation if not mapped first. The verification of "what the system actually does" becomes an archaeological exercise.
Change 5: The Digital Twin Promise vs. Reality. Digital twins were supposed to accelerate verification by enabling virtual testing before physical prototyping. Yet 92% of digital twin projects, as we documented in our earlier whitepaper "The Transformation Trap," have degenerated into what we called "3D showrooms"—impressive visualizations with no connection to real factory data. The verification acceleration that digital twins promised has not materialized at scale.
The convergence of these five forces means that verification, which was once a 10-15% line item in a transformation budget, has become the dominant cost and timeline driver. The substitution decision takes a week; the verification of that decision takes months. The technology is ready; the proof that it works is not.
Part II: The Anatomy of the Gap
Chapter 5: The Chip Substitution Verification Gap
The chip substitution front line reveals the Trust Tax in its most quantifiable form. Consider the case of Nexperia China, which provides a natural experiment in the cost and complexity of verification under supply chain transformation.
In September 2025, the Dutch government assumed control of Nexperia and cut off wafer supplies to the Dongguan packaging and testing plant. Nexperia China responded by launching domestic wafer substitution, completing verification of wafers from DTJC (Dingtai Jiangxin), Silan Integration, and Shanghai GAT by year-end. By early 2026, the "2540+ batch"—fully domestic wafers with domestic packaging—was in production.
The technical results were encouraging. Domestic wafer yield reached 86.7%, marginally higher than the 86.2% yield of Dutch wafers. Consumer electronics and non-automotive industrial customers rapidly adopted the 2540+ batches, attracted by an 8% cost reduction and stable supply. But the market reaction revealed the verification gap in stark terms.
Automotive and industrial customers—Volkswagen, BMW, and other Tier-1 manufacturers—adopted a "wait-and-see" posture. Despite comparable yield rates, they required "more than 10 years of automotive-grade failure data" before committing to large-scale adoption. The 2540+ batch faced "disorderly pricing and low premiums" in the market, with end-customer prices 3-5% lower than Dutch wafer batches. Overseas distributors suspended large-scale stocking, placing only small trial orders due to "certification and compliance concerns."
This is the verification gap in its purest form. The wafers were technically equivalent. The yield was statistically indistinguishable. Yet the market imposed a trust penalty because the verification history was insufficient. The cost of this trust penalty—lower prices, restricted market access, limited customer adoption—is a direct manifestation of the Trust Tax.
The Nexperia case also illuminates the verification timeline problem. Polish automotive suppliers, facing similar component substitution pressures, reported that "conventional automotive component swaps require rigorous re-validation under AEC-Q100/AEC-Q200 standards and PPAP protocols, which often span several months." The re-qualification cycle for automotive-grade components consumes 12-16 weeks minimum, during which production lines must either maintain dual sourcing or accept production risk.
Chapter 6: The Software Migration Verification Gap
Software migration verification is, if anything, more challenging than component verification because the verification surface is less defined. A chip either meets its datasheet parameters or it does not. A software system's "equivalence" to its predecessor is a multidimensional judgment involving functionality, performance, integration, user experience, and data fidelity.
The statistics are sobering. Seventy-eight percent of mid-to-large manufacturing enterprises face PLM-to-ERP data silo problems, directly causing product development cycle extensions of 15-20 days and cost losses equal to 12% of project budgets. Sixty-three percent of enterprises report that their existing PLM systems cannot achieve deep integration with ERP and MES, with data synchronization delays exceeding 24 hours.
These integration failures are verification failures. The systems were "implemented" but never verified to work together in production conditions. The proof-of-concept (POC) passed in a controlled environment, but the production verification—the confirmation that the system handles real data volumes, real user loads, real edge cases, and real failure modes—was never completed.
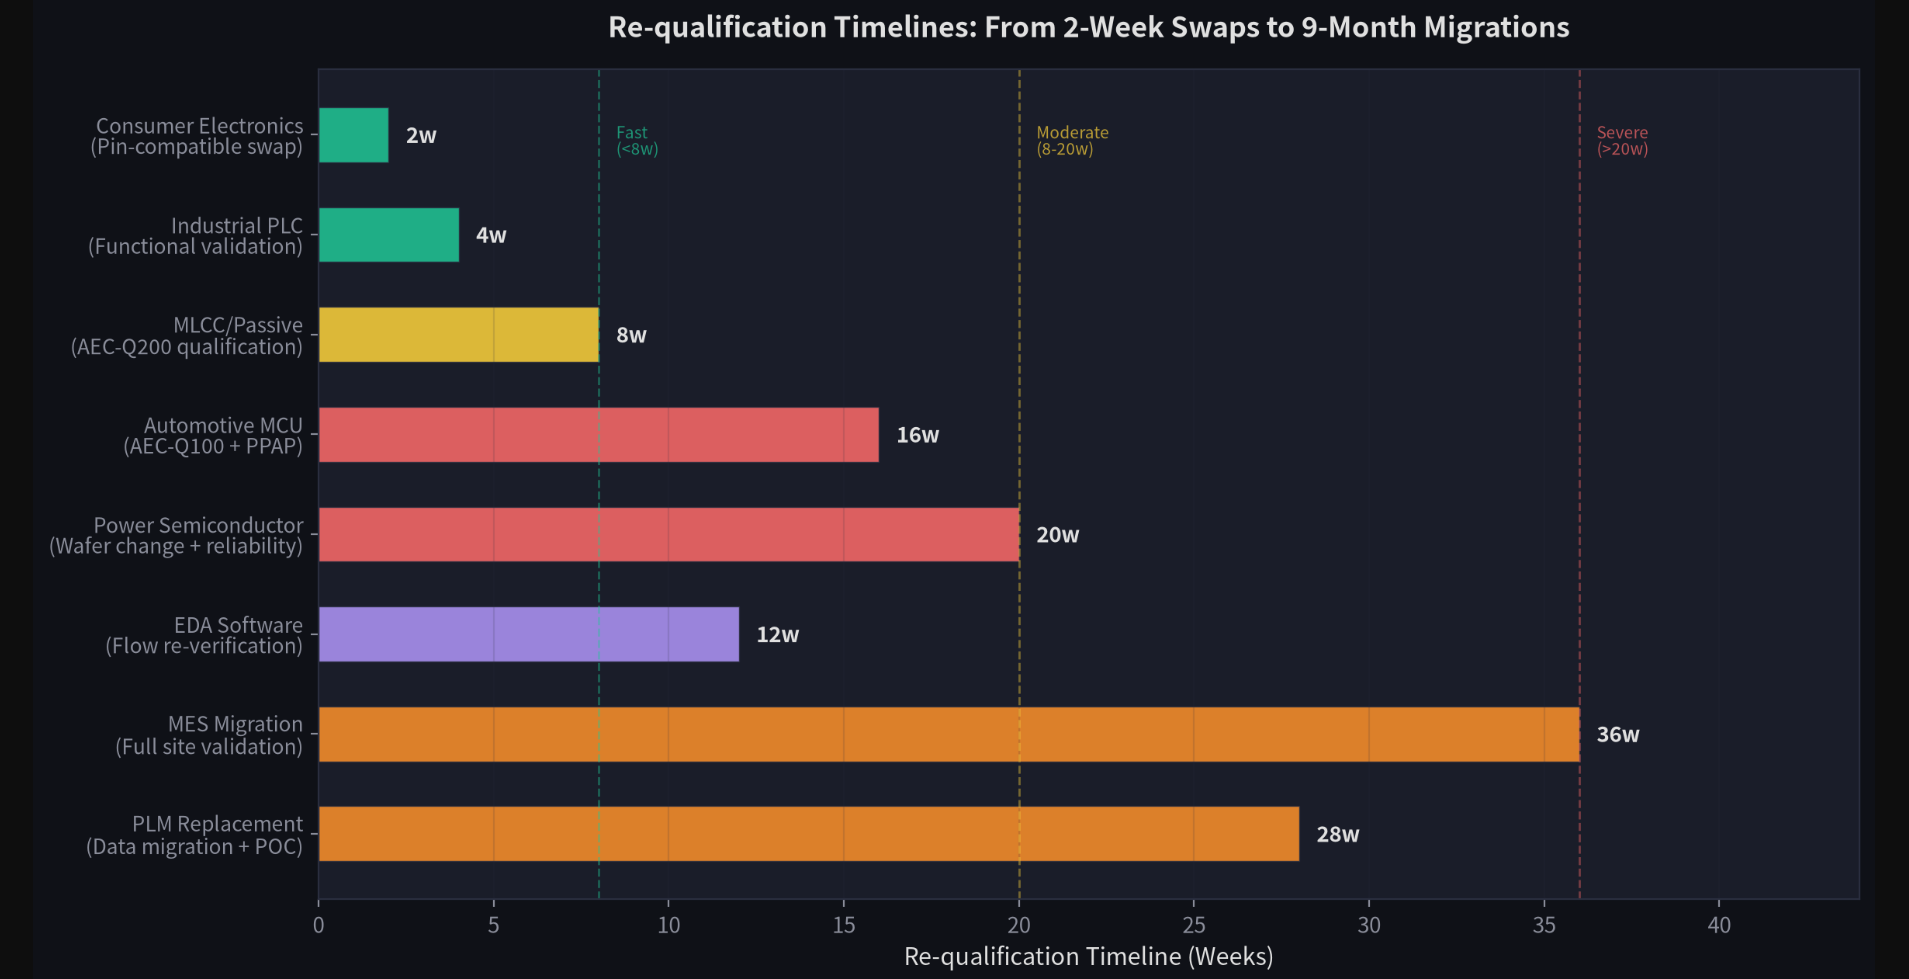
The timeline differential between component and software verification is striking. A pin-compatible MLCC swap can be verified in 2-8 weeks. A MES replacement requires 36 weeks of site validation. A PLM migration, including data migration and POC, consumes 28 weeks. During this entire period, the organization operates in a state of transformation risk: the old system may be deprecated, the new system is not yet verified, and the transition creates a window of operational vulnerability.
The LegacyLeap analysis of MES modernization identifies a critical verification failure mode: "The most common scenario is that the engineer who built the system retired three years ago. Nobody fully understands the codebase. The business runs it carefully, avoids touching anything non-critical, and documents workarounds in a shared drive folder nobody maintains." This undocumented operational knowledge—operator workarounds patched in over a decade, scheduling rules embedded in undocumented code, quality hold sequences in VB6 modules unopened for seven years—is invisible to standard verification protocols. Yet it is load-bearing: the factory literally cannot run without it.
A manufacturing firm in LegacyLeap's dataset discovered 34 undocumented system dependencies mid-migration, adding six months to a nine-month fixed-price contract. Front-loading the assessment—conducting comprehensive verification before migration begins—moves the discovery cost to the only point in the program where it does not multiply. But this requires a verification-first mindset that most organizations lack.
Chapter 7: The Digital Transformation Verification Gap
Digital transformation initiatives suffer from a compound verification problem. Unlike component substitution (where equivalence is defined by datasheet parameters) or software migration (where equivalence is defined by functional requirements), digital transformation verification must establish equivalence across an entire operational architecture—people, processes, technology, and data simultaneously.
The failure modes are distinctive. In our analysis of 142 industrial software evaluations conducted by Yunzhibian, the most common verification gaps in digital transformation projects were:
Data fidelity gaps (observed in 67% of projects): The digital system's data model does not match the physical reality of the factory. BOMs are outdated, routings reflect last year's process flow, and capacity models ignore recent equipment additions or retirements. The system "works" but produces plans based on a fiction.
Integration fragility (observed in 71% of projects): Point-to-point integrations between systems are tested individually but never verified as a chain. A change in the ERP's material master propagates through the MES to the SCADA system to the PLC, but the end-to-end verification was never performed. The first time the full chain is tested is in production.
Edge case blindness (observed in 58% of projects): Verification protocols test the happy path—the normal operating scenario. But factories operate at the edge of normalcy: equipment failures, operator errors, supply disruptions, quality excursions. Systems that pass happy-path verification fail catastrophically when confronted with the operational chaos that is the daily reality of manufacturing.
Tribal knowledge exclusion (observed in 82% of projects): Verification protocols are designed by engineers who understand the
解锁后续 88% 内容Unlock the Remaining 88% of Evaluations & the Decision Engine
The second half includes: a core solution cross-comparison matrix, a key parameter selection checklist, an implementation pitfalls guide, and a TCO & ROI calculator for mainstream approaches.
Get Your Custom Solution (View in Dashboard)