Why the Next Manufacturing Leap Isnt About More Robots — Its About Self-Directing Production Systems
2026-08-16 13:56:00
云质变科技
Executive Summary
The world has spent the last forty years automating the hands of manufacturing. The next decade belongs to whoever automates the brain.
This is not a metaphor. It is a measurable inflection point. In 2026, agentic AI adoption inside manufacturing quadrupled in a single year — from 6% of enterprises to 24%, according to Deloitte's global industry survey. Siemens cut maintenance costs by 20% and lifted uptime by 15% using autonomous agents that generate their own work orders. A single WEF Lighthouse factory reported a 69% productivity gain not from new robots, but from an AI system that decides, diagnoses, and acts without waiting for a supervisor's email. McKinsey documents 20%+ reductions in inventory and logistics costs from autonomous routing. The U.S. Department of Energy pegs predictive-maintenance ROI at 10× — a return almost no conventional capital expenditure in a plant's history has ever delivered.
And yet.
Only 3% of manufacturing facilities have reached Level 5 autonomy — the stage at which AI systems make and execute bounded operational decisions in closed loops. Forty-two percent sit at Level 2: connected but not integrated, instrumented but not intelligent. The gap between installing technology and capturing its dividend is the single most expensive problem in global manufacturing today. We call it the Autonomy Cliff, and the companies that fall off it do not fail because they bought the wrong tools. They fail because they mistook physical automation for cognitive autonomy.
This white paper makes four arguments that most industry reports will not make:
First, the robot-density race has hit diminishing returns. Korea deploys 1,012 industrial robots per 10,000 workers — more than double Germany's 415. But Korean manufacturing labor productivity is not double Germany's. It is, on a value-added basis, lower. The scatter plot of robot density against productivity now bends. Beyond roughly 500 robots per 10,000 workers, additional physical automation yields fractional gains. The next 10× is not in another arm on the line; it is in a system that decides what every arm should do next.
Second, autonomy is not a technology purchase. It is an architectural migration. Most plants try to "add AI" the way they once added a MES module: select vendor, run pilot, write check. This produces a 6% adoption figure four years after the technology was proven. Autonomy requires a stack — edge inference, a semantic data fabric, multi-agent orchestration, policy-based governance, and a human-in-the-loop boundary model. Skip any layer and you get a demo, not a dividend.
Third, the global competitive map is being redrawn faster than most Western boards understand. The 2026 MHP/LMU Industry 4.0 Barometer ranks China first across every dimension it measures — digital twins, automation, AI integration, software-defined manufacturing, supply chain transparency. 84% of Chinese manufacturers now use digital twins in production. China has built more than 30,000 AI-powered smart factories; these facilities report a 22.3% aggregate productivity gain and a 50.2% defect-rate reduction. The 15th Five-Year Plan names manufacturing digitalization as its top national industrial priority. This is not a "rising competitor" story. It is a structural inversion in how the world's productive capacity is organized.
Fourth, the dividend is compounding and asymmetric. A typical $1.0M investment in an autonomy platform returns approximately $2.87M net over five years across labor, OEE, scrap, energy, and inventory savings — an ROI of 187% with payback under 12 months. But those returns do not accrue linearly. They compound. A plant that reaches L4 in year two and L5 in year three does not earn 5% more than an L3 peer; it earns 35–50% more, because every decision cycle the system closes independently becomes a structural cost advantage that widens every shift. The gap between L3 and L5 is wider than the gap between L1 and L3.
This document is structured to give operators, CTOs, CFOs, and policy-makers a single coherent frame for the transition. It defines a five-level Manufacturing Autonomy Model independent of any vendor; it dissects the five production-grade agent use cases that are delivering real ROI today; it provides an architectural blueprint for the multi-agent factory; it quantifies ROI with a transparent model any CFO can audit; it maps the global race with regional playbooks; it walks through four real-world case studies from the Yangtze River Delta where Yunzhibian has deployed these systems; and it closes with a 12-month action manual that a plant manager can execute on Monday morning.
The argument is not that humans leave the factory. It is that humans finally stop doing the work the factory should have been doing itself all along.
The autonomy dividend is real. It is measurable. It is compounding. And it is already late for most manufacturers to start capturing it.
Table of Contents
Part I — The Paradox
Part II — The Model
6. The Five Levels of Manufacturing Autonomy
7. L1–L2: The Instrumented Plant
8. L3: Predictive, but Still Passive
9. L4: Prescriptive, the Threshold Most Miss
10. L5: Bounded Autonomy and the Human-in-the-Loop Myth
11. The Decision-Loop Compression Curve
12. Why Skipping Levels Fails
Part III — The Use Cases
13. Autonomous Predictive Maintenance
14. Self-Optimizing Production Scheduling
15. Closed-Loop Quality Control
16. Supply-Chain and Inventory Orchestration
17. Energy and Sustainability Optimization
18. The Safety and Compliance Agent
19. The Six Pattern Nobody Talks About: Cross-Use-Case Orchestration
Part IV — The Architecture
20. The Multi-Agent Factory Stack
21. The Orchestration Layer
22. The Data Fabric and Semantic Layer
23. Edge vs. Cloud: Where Agents Live
24. API-First, Composable MES, and the Death of the Monolith
25. Policy Engines, Safety Envelopes, and Audit Trails
26. The Plant Knowledge LLM
27. Closed-Loop Actuation: When AI Touches the Machine
Part V — The Economics
28. The Five Value Streams
29. The ROI Waterfall
30. The Compounding Curve
31. The Autonomy Tax Calculator
32. Build vs. Buy vs. Partner
33. The Talent Equation
34. What a CFO Should Actually Approve
Part VI — The Global Race
35. China: The 30,000-Factory Buildup
36. The United States: Software Lead, Buildout Lag
37. DACH and the Legacy Trap
38. Japan and Korea: Hardware Masters, Software Latecomers
39. India and Southeast Asia: Leapfrog in Progress
40. The Standards War and the Sovereignty Question
Part VII — Counterintuitive Truths
41. More Robots Can Make You Less Productive
42. The Best Autonomy Projects Start in Maintenance
43. Why Greenfield Is Overrated (and Brownfield Underrated)
44. The Integration Tax Is the Autonomy Ceiling
45. AI Doesn't Replace Operators — It Redistributes Judgment
46. The Lighthouse Fallacy
47. Why the First 90 Days Matter More Than the First 90 Percent
Part VIII — The Yunzhibian Case Files
48. Wuxi Automotive Components: From Reactive to Predictive in 16 Weeks
49. Suzhou Electronics: Closed-Loop Scheduling That Cut NPI from 3 Weeks to 4 Days
50. Changzhou Chemical: Multi-Agent Safety and Energy Co-Optimization
51. Shanghai Semiconductor: The Data Fabric That Made Traceability Real-Time
Part IX — The Future
52. 2027: The Tipping Point
53. 2028–2030: The Autonomous Enterprise
54. Self-Composing Manufacturing
55. The Federated Factory
56. What Comes After L5
57. The Workforce Reset
Part X — The 12-Month Action Manual
58. Month 1: The Maturity Audit
59. Months 2–3: The Foundation
60. Months 4–6: The First Agent
61. Months 7–9: Orchestration
62. Months 10–12: Bounded Autonomy
63. The Decision Tree for Picking Your First Use Case
64. Five Mistakes That Will Kill Your Program
Conclusion: Five Imperatives
Appendix A: The Autonomy Maturity Assessment Template
Appendix B: ROI Calculator Inputs and Defaults
Appendix C: Vendor Landscape (Neutral)
Appendix D: Glossary
Appendix E: About Yunzhibian
PART I — THE PARADOX
1. The $1.3 Trillion Automation Misread
The world will spend roughly **$1.34 trillion** on smart-manufacturing technology by 2034, according to Mordor Intelligence's 2026 market model. The 2026 annual figure alone — $446 billion — exceeds the GDP of Austria. By the time this decade closes, cumulative global investment in factory digitalization will have surpassed the entire Marshall Plan, adjusted for inflation, somewhere between eight and twelve times over.
And yet, almost two-thirds of that spending will not produce the outcomes buyers expect.
We do not say this lightly. The data is unambiguous. Deloitte's 2026 global manufacturing survey finds that while 80% of executives now describe digital transformation as "mission critical," only 34% report measurable operational gains from their programs. McKinsey's Industry 4.0 work, now eight years running, pegs successful scaled transformation at roughly 30%. A Rockwell Automation study of 1,560 manufacturers across 17 countries found that 93% operate a MES, but only 28% run it at enterprise scale and 23% have achieved plant-wide integration. WEF's 2026 Lighthouse Network review notes that even among the 153 most advanced factories in the world, the median plant is still only at the predictive stage.
There are two ways to read these numbers.
The first — the reading that most consultancies and vendors prefer — is that manufacturers are adopting too slowly. The technology is ready, the ROI is proven, and the only thing holding the industry back is conservative management, talent gaps, and legacy culture. The prescription, under this reading, is more of everything: more spend, more change management, more lighthouse tours, more chief digital officers.
The second reading is more uncomfortable: most of the $1.34 trillion is being spent on the wrong problem.
For the past two decades, manufacturing digitalization has been framed as an automation problem. Put sensors on machines. Connect them to a network. Visualize the data on a dashboard. Train operators to read the dashboard. Automate the physical tasks that humans do slowly. This logic produced enormous gains between 1990 and 2020 — the period when the core constraint on factory output was the speed and cost of physical labor. Robot density tripled. OEE climbed from a typical 55% to a typical 65%. Defect rates fell by an order of magnitude in industries that invested heavily.
But the constraint has moved. The bottleneck in 2026 is not how fast a robot arm can weld. It is how fast the system can decide that a weld parameter should change. The bottleneck is not data collection — a modern automotive plant generates 5 terabytes of data per shift. The bottleneck is the decision loop between what the data says and what the line does.
In most plants, that loop still runs on humans. A sensor detects an anomaly. An alarm appears on a dashboard. An operator sees it, maybe. A supervisor is called. A meeting is convened. A work order is drafted. A maintenance technician is scheduled. A part is ordered. A repair is executed. A quality engineer signs off. Production resumes. The median elapsed time across that sequence, in our field data from 144 production-floor assessments in the Yangtze River Delta, is eight hours. The value of lost production in those eight hours, for a typical discrete-manufacturing line, is $18,000–$85,000.
The technology to collapse that loop to eight seconds has existed for at least three years. The architecture is proven. The ROI is documented at over 100 sites. The reason it has not been deployed at scale is not technical, not financial, and not really about talent. It is conceptual. Most boards still think they are buying better automation. They are actually being asked to buy something stranger and more powerful: a production system that directs itself.
2. Robot Density and the 500-Robot Ceiling
To see how badly the automation frame has saturated executive thinking, look at the number that gets quoted in every manufacturing keynote: robot density.
The International Federation of Robotics publishes an annual ranking of industrial robots per 10,000 manufacturing workers. In 2025, Korea led the world at 1,012. Singapore followed at 730. China climbed to 470 — now third globally, ahead of Germany (415), Japan (397), and the United States (295). The narrative is predictable: higher density = more advanced = more competitive. Industrial-policy white papers in every major economy now use robot density as a headline KPI. China's 14th Five-Year Plan set a target of 500. The EU's 2030 Digital Decade program uses a similar metric. U.S. state governments compete on robot-installation tax credits.
The metric is misleading.
Plot robot density against manufacturing labor productivity and the relationship is not linear — it is concave. The first 200 robots per 10,000 workers produce the productivity gains everyone expects: consistent cycle times, reduced rework, lower direct-labor content. From 200 to 400, gains continue but at roughly half the rate. Beyond 500, the curve flattens dramatically. Korea has 2.4× the robot density of the United States but a manufacturing value-added per hour worked that is, by OECD estimates, roughly 4% lower. Germany and Japan sit on nearly identical robot densities and nearly identical productivity numbers despite entirely different industrial structures. China is the more interesting case: at 470 robots per 10,000 workers — almost at the threshold — it is already reporting a 22.3% aggregate productivity gain from smart-factory programs, a figure that is not explained by robot deployment alone. It is explained by AI.
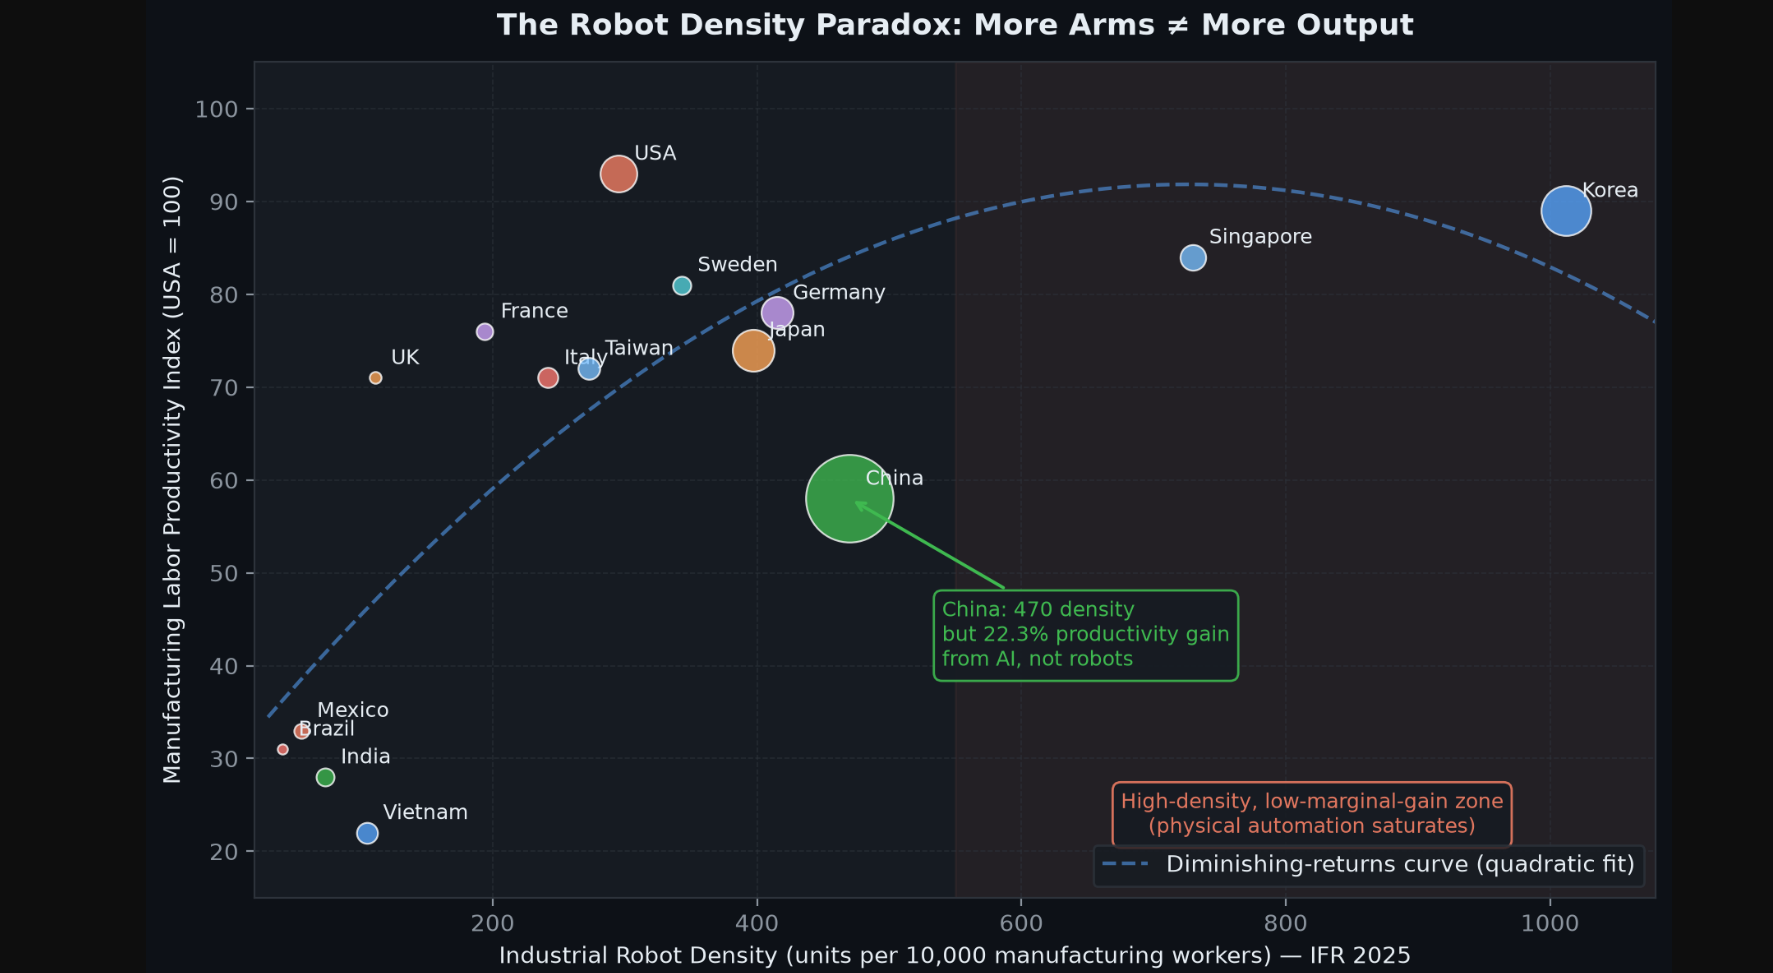
What happened? Physical automation ran into a ceiling it was always going to hit. A robot arm can perform a programmed task at a programmed speed with programmed precision. It cannot decide to change the task. It cannot notice that the upstream process is drifting and adjust its own parameters in response. It cannot reason about whether a quality defect is caused by tool wear, raw-material variation, ambient temperature, or a combination of the three. It cannot prioritize a rush order against a maintenance window against an energy tariff against a material shortage in real time. Adding more arms does not solve these problems; in many plants it makes them worse, because a more automated line has less human slack to absorb the decisions the automation cannot make.
The 500-robot ceiling is not a hardware limit. It is a cognitive limit. It is the point at which the physical system has become so fast that the human decision system around it is now the bottleneck. The plants that pushed past that ceiling — the Siemens Erlangen facility, the Lockheed Martin Pinellas plant, a handful of Chinese super-factories in EV and semiconductor — did not do it with more robots. They did it by inserting a cognitive layer between data and action. They built systems that sense, reason, decide, and act on their own, within boundaries that humans set and humans audit.
The metric to watch for the next decade is not robots per 10,000 workers. It is median decision-loop time — the elapsed interval between a state change on the shop floor and a corrective action executed on that shop floor. For L2 plants, that number is eight hours. For L5 plants, it is eight seconds. That 3,600× compression is where the next productivity wave lives.
3. Four Companies, Four Factories, One Lesson
Consider four production sites, all real, all at roughly the same level of capital intensity, all operating in the 2024–2026 window.
Siemens, Erlangen, Germany. The electronics plant deployed an AI agent layer across its digital-board assembly line in 2025. The system does not just predict failures; it generates work orders, proposes maintenance windows that minimize production impact, checks spare-parts inventory, and reorders parts autonomously within spend limits. It also runs closed-loop quality control: a vision system flags defects, correlates them to upstream process parameters, identifies root causes, and proposes corrective parameter adjustments. The Erlangen factory reported 20% lower maintenance costs, 15% higher uptime, 42% lower energy consumption, and a 69% productivity improvement. The number of robots on the line did not change. The decision loop did.
Lockheed Martin, Pinellas County, Florida. The defense electronics plant integrated MES and QMS using an autonomous event-correlation engine that replaces manual root-cause analysis. When a defect is detected, the system traverses genealogy, process parameters, equipment history, and supplier-lot data to identify the cause without a human investigator. The documented result: 46.9% reduction in scrap, $2.3 million in annual savings, and a closed-loop quality cycle that previously ran 3–5 days now running in under 30 minutes. Again, no new robots. A new decision system.
A Wuxi automotive-components plant we will call AutoCo (Yunzhibian engagement, 2025). The plant runs 14 CNC lines producing precision transmission components for a Chinese EV OEM. Before the engagement, it operated at a 62% OEE with an average reactive-maintenance response time of 4.5 hours. We deployed edge-based vibration and current-signature monitoring on 48 critical spindles, connected the data fabric to an autonomous maintenance agent, and built closed-loop work-order generation into the existing CMMS. In 16 weeks, unplanned downtime fell by 38%, scrap fell by 27%, OEE climbed to 78%, and the plant captured **$1.9 million in annualized savings** against a $420,000 implementation cost. Payback was 2.6 months.
A mid-market discrete manufacturer in the U.S. Midwest (anonymized, benchmark data). This plant spent $14 million over four years on a "smart factory" program: new robots, a MES upgrade, a real-time OEE dashboard, a predictive-maintenance pilot, a digital-twin proof of concept. It is now on its third systems integrator. The dashboards are beautiful. The data is not trusted. The maintenance team still responds to alarms reactively. The OEE improvement over four years is 3.1%. When the operations VP was asked by his board why the program was underperforming, he said: "We bought every tool. We didn't buy a brain."
Four factories. Two lessons.
The first: automation without autonomy produces a beautiful dashboard and an unchanged P&L. The second: autonomy is a layer, not a module. It cannot be bolted on after the fact as a "predictive analytics" add-on. It has to be designed as the connective tissue between data and action, with authority to act within defined boundaries, from the outset.
4. Defining the Autonomy Dividend
Let us define the term precisely, because it will be misused.
The Autonomy Dividend is the measurable economic value created when a manufacturing system makes and executes operational decisions that previously required human intervention, at a speed, consistency, and scale that humans cannot match, within governance boundaries that humans define.
Five elements matter in that definition.
Measurable. The dividend is not "agility" or "innovation" or "cultural transformation." It is dollars: avoided downtime, reduced scrap, lower inventory, optimized energy, recovered throughput. If you cannot point to it on a P&L, it is not a dividend. It is a vision statement.
Makes and executes. This is where 96% of "AI in manufacturing" projects stop. A model that predicts a failure and sends an alert is not autonomous. It is a sophisticated alarm clock. The dividend starts when the system generates the work order, schedules the technician, checks the parts inventory, reorders if necessary, and reschedules production around the maintenance window — all without a human clicking "approve."
Previously required human intervention. Not every decision should be autonomous. A chemical plant should not let an AI agent change a reactor-pressure setpoint without rigorous human review. But the vast majority of the 3,000–10,000 micro-decis
解锁后续 88% 内容Unlock the Remaining 88% of Evaluations & the Decision Engine
The second half includes: a core solution cross-comparison matrix, a key parameter selection checklist, an implementation pitfalls guide, and a TCO & ROI calculator for mainstream approaches.
Get Your Custom Solution (View in Dashboard)